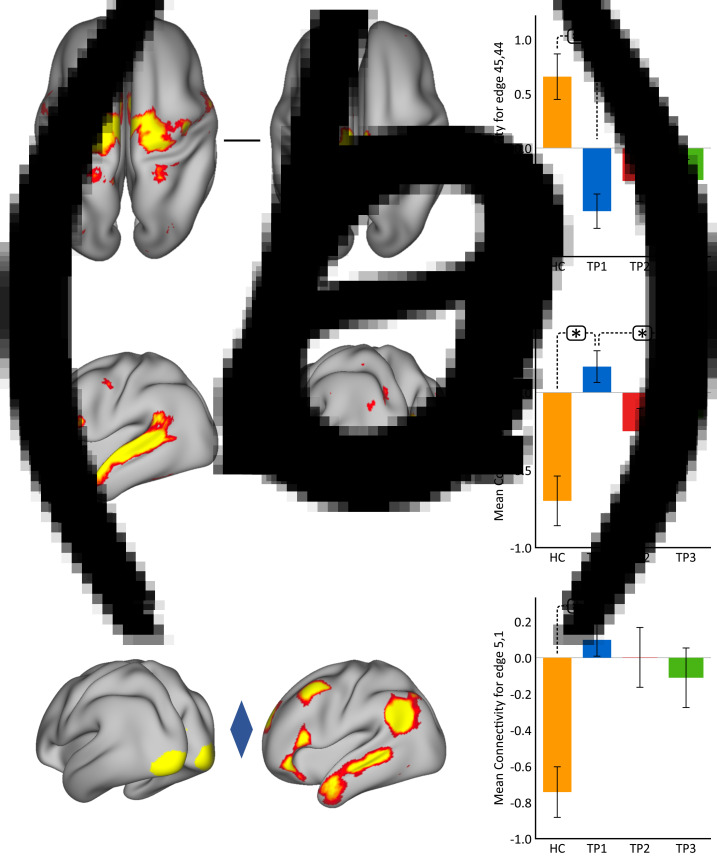
Fig. 2.
Cross-sectional effects: controls v. MDD. (a) FC between nodes in the SMN is significantly lower in MDD as compared to controls; node 45: premotor cortex, Brodmann area (BA) 6; node 44: primary motor cortex, BA 4a. (b) FC between association and visual network is significantly higher in MDD as compared to controls; node 25: temporal lobe; node 14: visual cortex V1 BA 17. (c) FC between the visual and DMN is significantly higher in MDD as compared to controls; node 5: visual cortex (V1, V2, V3); node 1: right DMN. The color of the diamond connecting the two nodes represents the sign of the group average (patients + HC at TP1) partial correlation (orange: positive, blue: negative). All images are thresholded at z > 8 for visualization. Bar plots show the mean FC for each of the significant (p < 0.05, FWE-corrected across the netmat) networks for HC and MDD patients at TP1, TP2 and TP3 (*p < 0.05).

