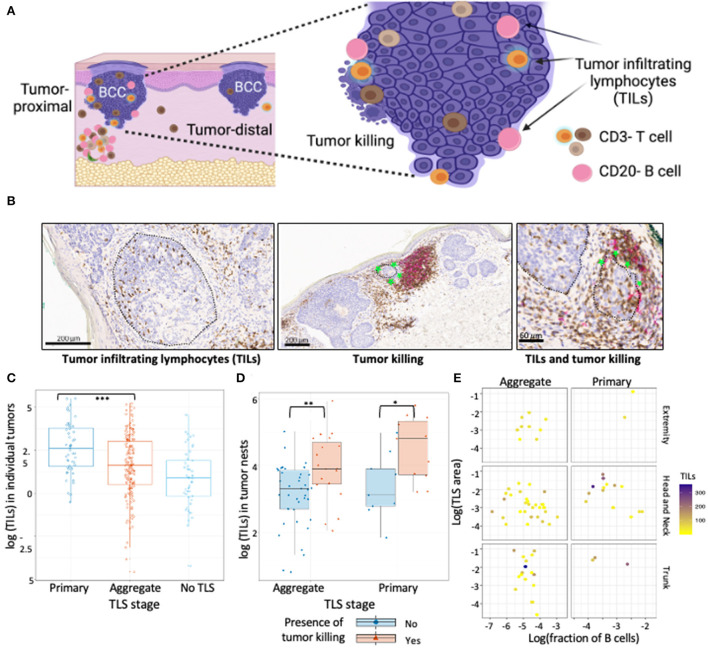
Figure 2.
TILs in BCC show association with TLS presence and maturation. (A) Schematic representation of tumor location with respect to TLS, TILs and tumor killing in BCC tumors. Proximal tumors were defined as adjacent to TLS, distal tumors were located farthest from the TLS. Infiltrating T and B cells inside annotated tumor boundaries were quantified and referred to as TILs. Tumor killing was defined as active tumor regression involving a combination of infiltrating immune cells along tumor periphery leading to disruption of the palisaded architecture and was graded as a binary variable for presence or absence. (B) Representative CD3/CD20 IHC images of TILs and tumor killing demonstrating CD3+ T cells (brown) and CD20+ B cells (pink) cells inside tumors (black encircled structures). Infiltrating CD3+ and CD20+ lymphocytes inside BCC tumors were referred to as TILs while infiltrating of immune cells along tumor edge that accompany a disrupted tumor border was referred to as tumor killing (green stars). (C) TILs distribution in tumors proximal to primary TLS, aggregate TLS and control cases (no TLS); data points represent individual tumors. Tumors proximal to primary TLS show significantly higher mean of TIL counts compared to tumors proximal to aggregate TLS (p-value < 0.001, approximated with Wald tests of the fixed effect in a linear mixed-effects model of Box-Cox transformed count of TILs, see Table 3). (D) Abundance of TILs in tumor nests proximal to TLS denoted for presence of tumor killing. Presence of tumor killing is associated with higher TIL counts for tumor nests proximal to primary TLS (p-value = 0.029) and similarly for tumor nests proximal to aggregate TLS (p-value = 0.01). P-values derived from Wald test for fixed effects in linear mixed-effect models. (E) Observation of TILs distribution with combined effect of TLS properties, TLS stage and body site; data point represents tumor nests. No significant difference in median TILs across TLS stage (primary vs. aggregate) was observed for individual TLS properties, body site determined by mixed effect model of log transformed TILs counts with random intercept defined for each BCC lesion (see Table 4). Created with BioRender.com.

