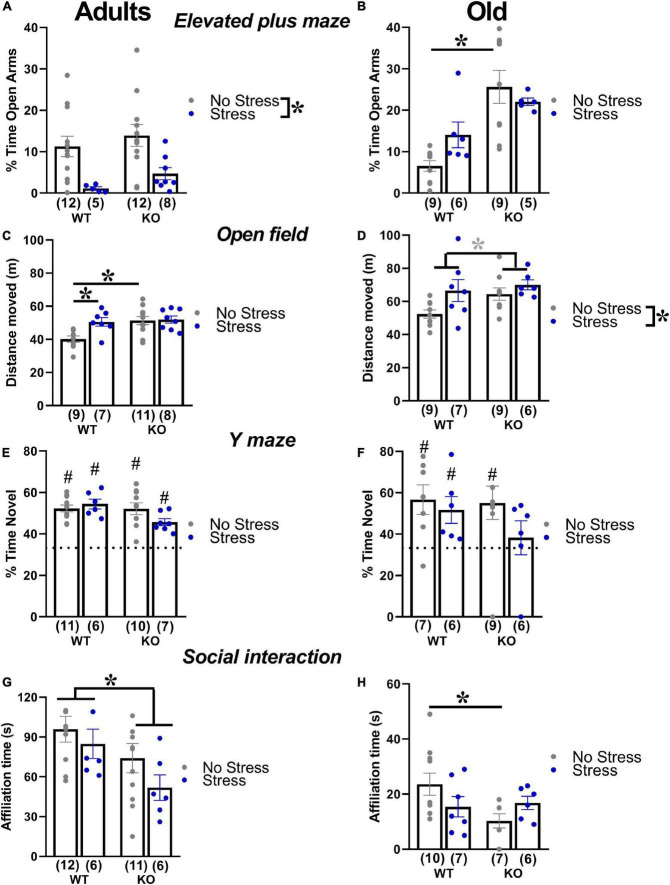
FIGURE 4.
Behavioral effects of prenatal stress in adults (3 months) and old (18 months) mice. Anxiety levels were investigated with the elevated plus maze test (A,B). Locomotion was assessed in the open field (C,D), while spontaneous alternation was evaluated in the Y maze (E,F). Social interaction was measured during a 3-min encounter with an adult NMRI WT female (G,H). *p < 0.05 from the 2 × 2 ANOVA at each age with genotype and stress as the between subject factors, leading to significant main effects of stress (A,D), genotype (G) or stress x genotype interaction followed by post-hoc tests (B,C,H). *p = 0.07 from the same ANOVA leading to a nearly significant main effect of stress (D). #p < 0.05 from the t-test versus chance level [indicated by dotted line in panels (E,F)] conducted in each experimental group. N for each group are indicated as (N) in each graph. Data are expressed as mean ± SEM.

