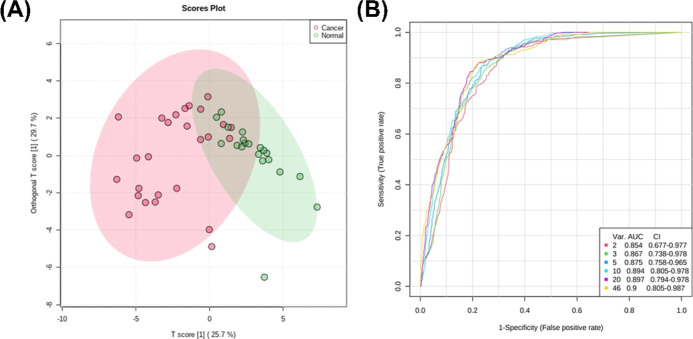
Figure 3.
Biomarker analysis of serum glycopeptides comparing lung cancer patients and healthy volunteers. (A) Score plot showing distribution of cancer patients (red) and healthy volunteers (green) across components 1 and 2 given by the OPLS-DA model for serum glycopeptides. (B) ROC curve analysis of serum glycopeptides.

