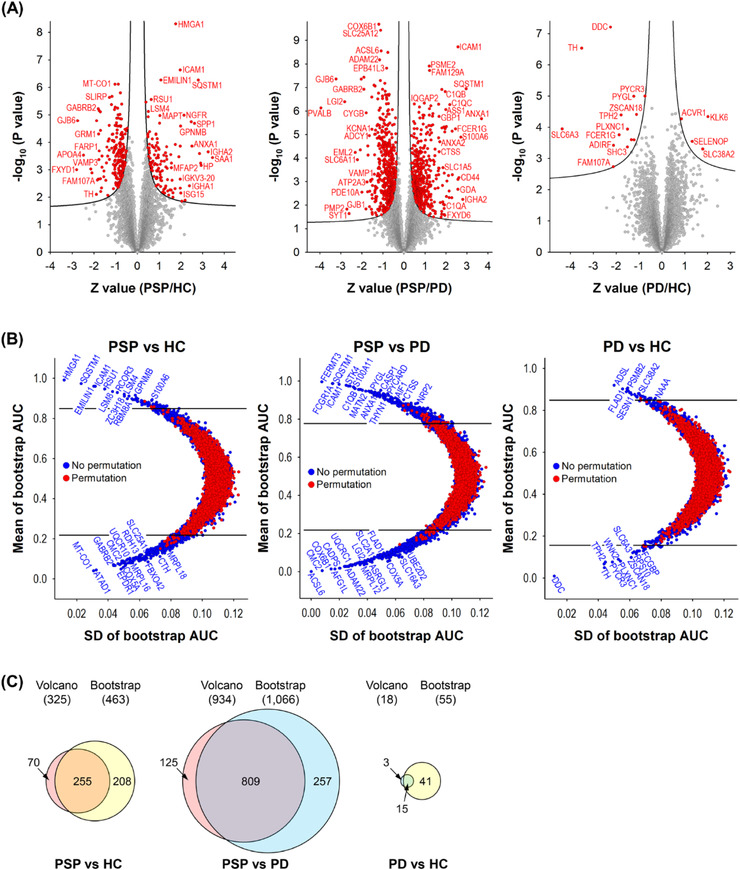
FIGURE 3.

Volcano and bootstrap ROC plots of the GP proteins identified from PSP, PD, and HC. (A) The differences of GP protein abundances from 15 PSP, 15 PD, and 15 HC were depicted on volcano plots. The curved lines are the boundaries for a q‐value of 0.05. The proteins with the q‐value <0.05 are coloured in red. The proteins on the left and right sides of the q‐value line are down‐ and upregulated ones, respectively. (B) Bootstrap ROC analyses were conducted to estimate variations of resampling. To calculate q‐values, bootstrap ROC analyses after permutation of the comparison groups were conducted too. The differentially expressed proteins with q‐values < 0.05 are shown at the outside of the upper and lower horizontal lines. The proteins on the upper and lower side of the q‐value line are upregulated and downregulated in PSP compared to HC (left), in PSP compared to PD (middle), and in PD compared to HC (right), respectively. (C) The differentially expressed proteins overlapping between the volcano plot and the bootstrap ROC analysis of each comparison group are shown in the Venn diagrams.
