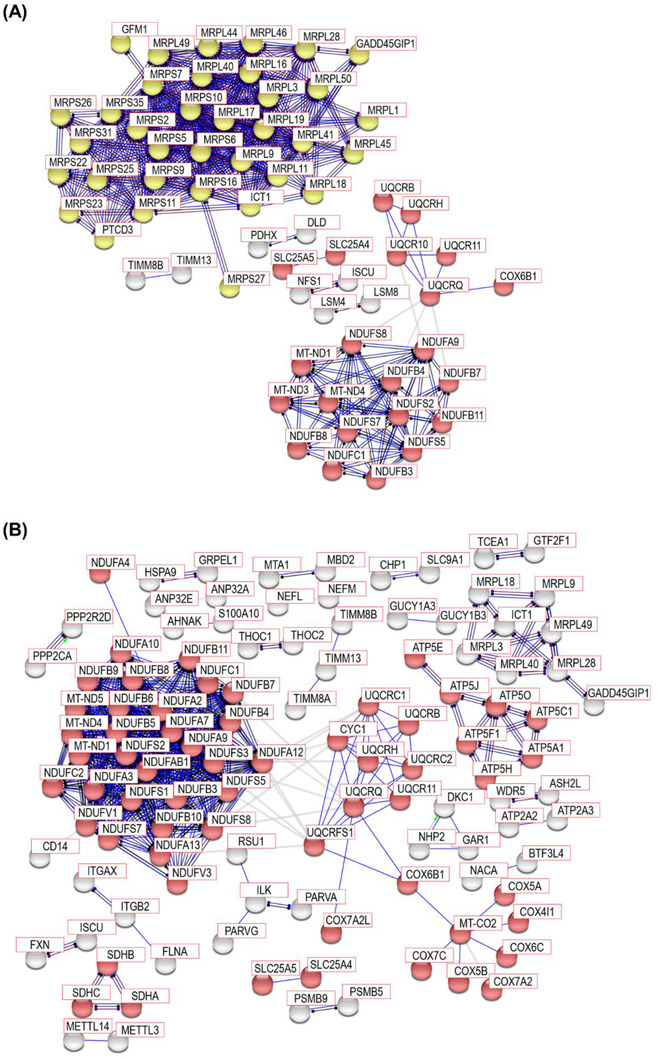
FIGURE 5.

STRING PPI analysis for network connectivity of the differentially expressed proteins in PSP compared to HC and in PSP compared to PD. STRING PPI analyses were conducted to estimate the connectivity of the differentially expressed proteins (A) in PSP compared to HC and (B) in PSP compared to PD. In the comparison between PSP and HC, the network contains 250 nodes with 980 edges. Only experimental data was used for the active interaction source with 0.9 highest confidence threshold of a minimum required interaction score (average node degree: 7.84, average local clustering coefficient: 0.482, and PPI enrichment p value < 1.0 ×10⁻¹⁶). In the comparison between PSP and PD, the network contains 796 nodes with 503 edges. Only experimental data was used for the active interaction source with 0.9 highest confidence threshold of a minimum required interaction score (average node degree: 1.26, average local clustering coefficient: 0.14, and PPI enrichment p value < 1.0 ×10⁻¹⁶). The red and yellow nodes denote Parkinson's disease and mitochondria translation‐related proteins, respectively. The grey nodes do not belong to any enriched pathways.
