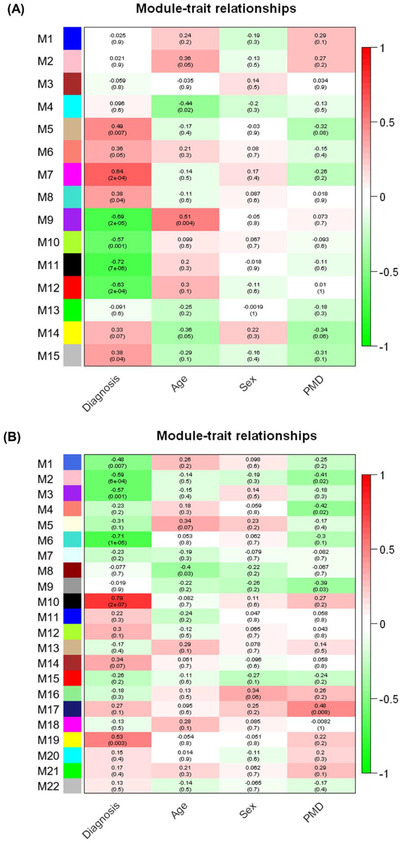
FIGURE 6.

WGCNA of GP proteome data to investigate the module‐trait relationships. The module‐trait relationships of the GP proteome data using WGCNA were presented in the form of heatmaps. WGCNA was conducted with proteins identified from (A) PSP and HC or (B) PSP and PD. Each module is composed of a group of proteins with similar expression patterns. The relationships between modules and traits were calculated by calculating Pearson correlations between modules and traits. The correlation scores are displayed on the top of each box. Red and green colours represent positive and negative correlations, respectively. p Values for the significance between modules and traits were calculated and displayed on the bottom of each box in the parenthesis.
