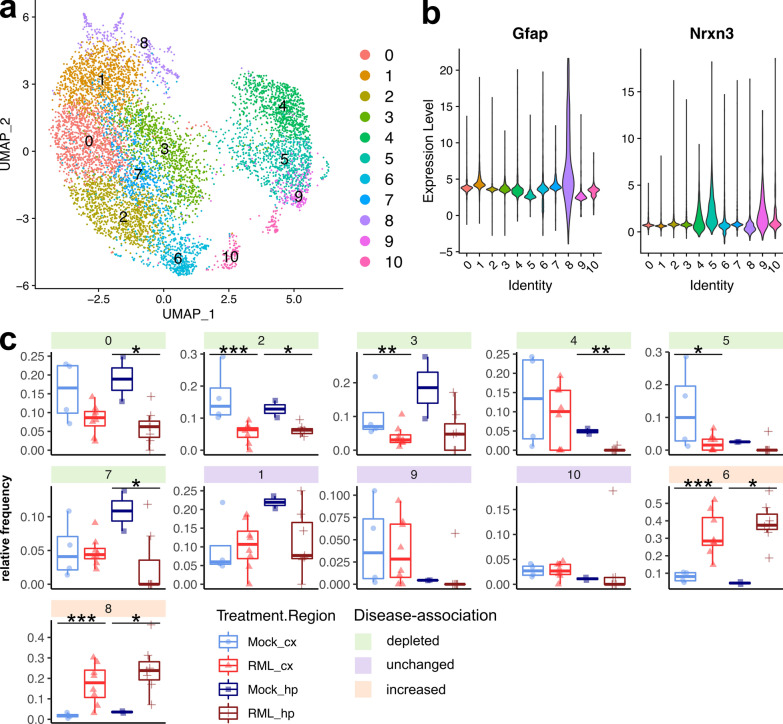
Fig. 6.
Sub-cluster analysis of astrocytes reveals disease-depleted and disease-associated subtypes during prion disease. A UMAP projection of all 7,813 astrocytes categorized into 11 sub-clusters. B Violin plots showing expression of Gfap and Nrxn3 across each astrocyte sub-cluster. C The relative frequency of each astrocyte sub-cluster is plotted for the cortex and hippocampus of RML and Mock infected mice. p values s were calculated using non-parametric Mann–Whitney U tests. * p values < 0.1, ** p values < 0.05, *** p values < 0.01. All p values are provided in Additional file 6

