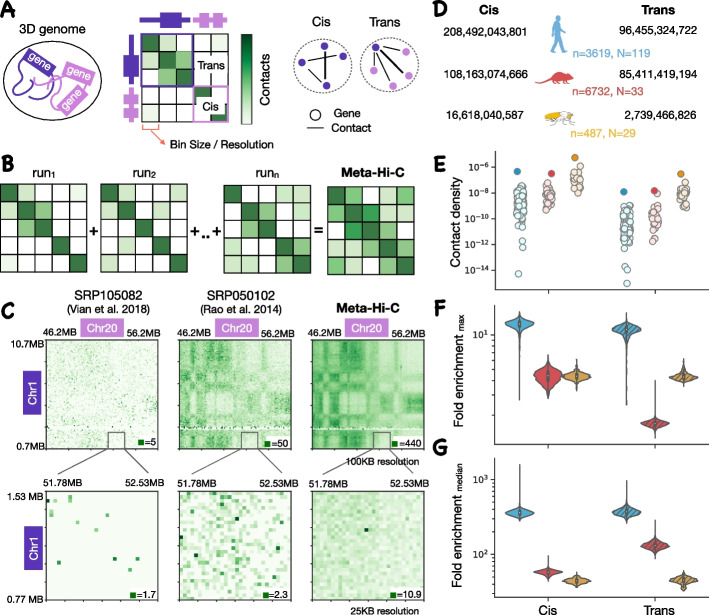
Fig. 1.
Creating the meta-Hi-C network. A Genes are co-localized in chromatin 3D structure through frequent chromatin contacts. Each chromosome is divided up into “bins” of a specific size referred to as resolution and the chromatin contact matrix represents the number of pair-ended reads spanning between a pair of bins. The contact matrix can be represented with networks where nodes are genes and edges are interaction frequencies. The cis and trans networks consist of intra-chromosome and inter-chromosome edges respectively. B Contact maps from individual Hi-C experiments are aggregated to create a meta-Hi-C contact map. C Visual comparison of our meta-Hi-C and two individual Hi-C contact matrices: Vian et al. [9] (a typical experiment) and Rao et al. [10] (densest experiment in trans) at 100-KB (top) and 25-KB resolutions (bottom). The maximum contact frequency is given at the bottom of each map. The high-intensity region observed in our meta-Hi-C contact matrix at 25-KB resolution belongs to gene UBEJ2 on Chr1 and ZFP64 on Chr20. Both these genes are also strongly coexpressed in our coexpression network with a coexpression strength of 0.98 on a genome-wide rank-standardized scale of 0 to 1. D Total number of contacts in cis and trans meta-Hi-C network of human, mouse, and fly. n and N are the numbers of runs and projects aggregated in each species respectively. E Contact density (total contacts/number of 1-bp bins) across individual projects in cis and trans for each species. Individual points are individual experiments and the darker shades of points are the values for the meta-Hi-C network. Distribution of fold enrichment of contacts among genes in the meta-Hi-C network relative to the maximum (F) or median (G) number of contacts for that gene among individual network in cis and trans. The total number of genes in F and G are 23,465, 20,672, and 9636 in human, mouse and fly respectively

