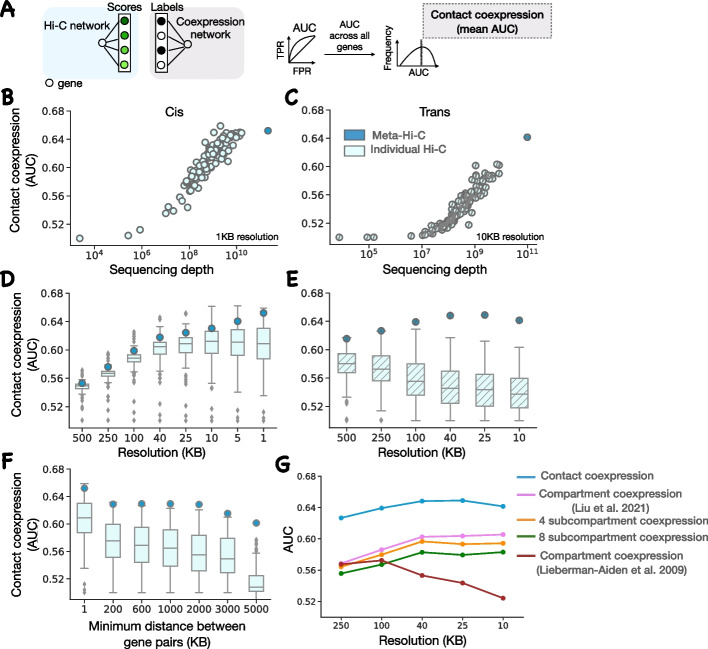
Fig. 2.
Meta-Hi-C network benchmarking. A Contact coexpression metric schematic. Circles represent genes and lines represent edges of that gene in respective networks. For each target gene, we use its ranked edges in the Hi-C network to predict the top 1% of its edges in the coexpression network. We perform this task for every gene and then report contact coexpression as the average AUC across all genes. B Contact coexpression for the individual and meta-Hi-C network in cis as a function of sequencing depth at 1-KB resolution C Same as (B) but in trans and at 10-KB resolution. D The boxplot shows the distribution of contact coexpression for each project at various resolutions in cis. Circles represent the performance of the cis meta-Hi-C network. E Same as (D) but using trans networks. F The boxplot shows the distribution of contact coexpression in cis at 1-KB resolution for each project at various distance thresholds. G Comparison of contact coexpression score of the meta-Hi-C network and compartment coexpression score at various resolutions. We called compartments in each individual network and then aggregated those calls, capturing the probability of sharing a compartment across data. The compartment coexpression metric captures the ability of aggregated compartment preference to predict coexpression. Subcompartment coexpression is defined analogously to compartment coexpression. Compartments were called using either the Liu et al. [23] method or the Liberman-Aiden et al. [8] method

