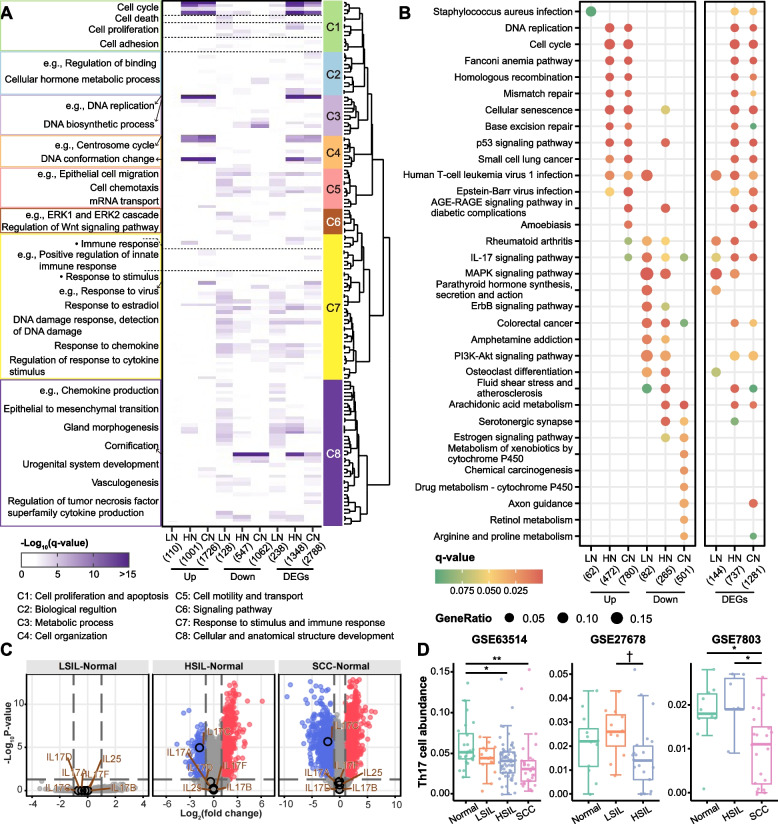
Fig. 3.
Functional enrichment and Th17 cell infiltration. A Heatmap showing the GO biological process terms enriched by up- and downregulated genes (Gene Sets1, 1 to 6 columns) and total DEGs (7 to 9 columns) of each comparison. The simplified GO terms significantly enriched by at least one comparison group were included and hierarchically clustered. Eight distinct clusters of GO terms that show high semantic similarity were identified. The color intensities indicate the −log10(q-value) of the enrichment test. See Additional file 2: Table S8 for the entire list of the enriched GO terms. B Dot plot showing the top 8 significantly enriched KEGG pathways in up- and downregulated genes (Gene Sets1, left panel) and total DEGs (right panel) of each comparison. Dot color indicates the q-value of the enrichment test; dot size represents the fraction of genes annotated to each pathway. The entire list of the enriched pathways and comparison can be seen in Additional file 2: Table S9 and Additional file 1: Fig. S3. C Volcano plots of GSE63514. Red and blue dots represent up- and downregulated genes, respectively; gray dots represent non-statistically significant genes. Vertical dashed lines indicate a 2-fold change cutoff in either direction, and horizontal dashed lines indicate an adjusted p-value cutoff of 0.05. IL17A through IL17F were circled and labeled with gene symbols. D Boxplots showing the abundance of Th17 cells changes over the disease stages. ** p < 0.01; * p < 0.05; † p < 0.1

