Fig. 6.
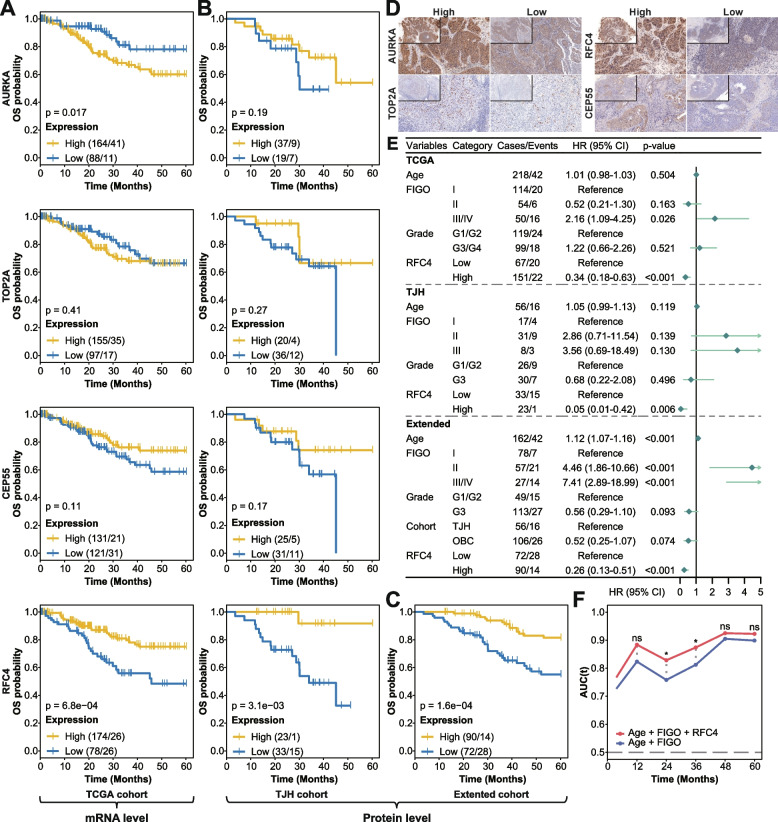
Univariate and multivariate survival analysis for OS in SCC patients, related to Additional file 1: Fig. S9. Five-year Kaplan-Meier curves for OS in SCC patients stratified by the hub gene expression (mRNA and protein) from A TCGA, B TJH, and C Extended cohorts. The number of cases and events are shown in the plots. The p-values were calculated with the log-rank test. The optimal cutoff values for HSCORE or staining intensity determined by the surv_cutpoint function from the survminer package were 130 for AURKA, 1 (staining intensity) for CEP55, 45 for TOP2A, and 100/105 (TJH/Extended) for RFC4. D Representative IHC staining images of high and low AURKA, TOP2A, RFC4, and CEP55 expression in SCC. Original magnification ×200. Inserts, original magnification ×100. E Forest plot of multivariate Cox regression with clinical features and RFC4 expression taken into account in three cohorts. The main effects are shown as hazard ratios with 95% confidence intervals. F Time-dependent AUC for combined RFC4 expression and clinical covariate model (red) and clinical covariate-only model (blue). The significant difference in the AUC was estimated at 1, 2, 3, 4, and 5 years, and adjusted p-values were calculated. HR, hazard ratio; CI, confidence interval. * 0.01 < p < 0.05; ns, p ≥ 0.1

