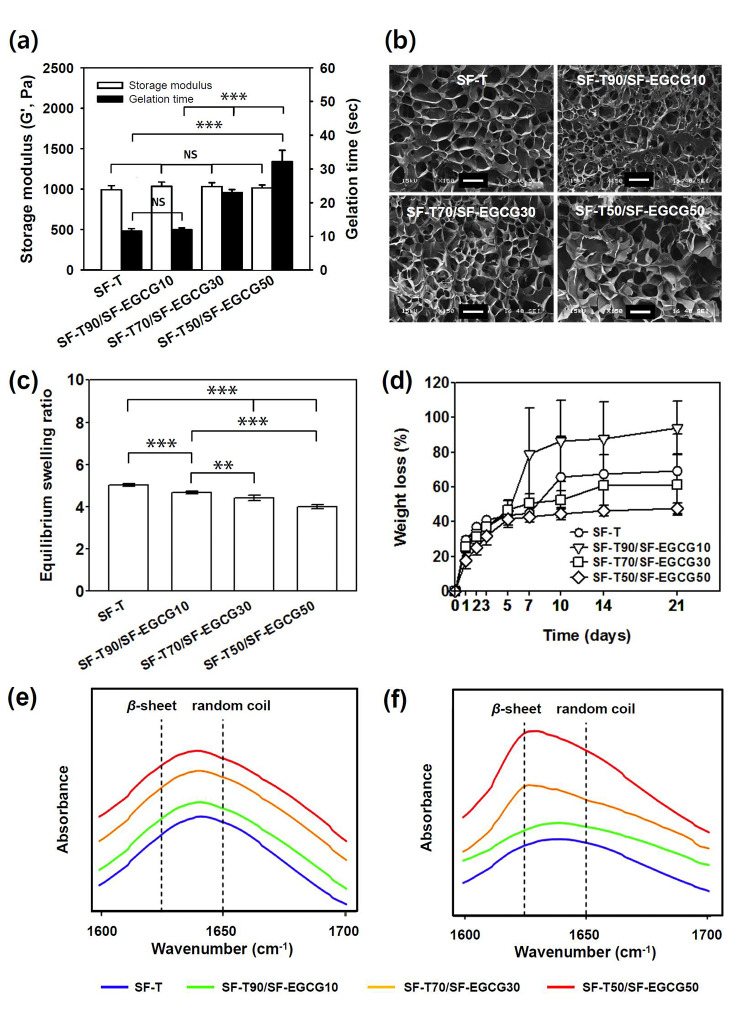
Fig. 4.
(a) Storage modulus and gelation time of the optimized SF-T hydrogel and SF-T/SF-EGCG composite hydrogels. (Mean ± SD, n = 5, NS: not significant, ***: p < 0.001). (b) Photomicrographs of cross-section of the lyophilized SF-T and SF-T/SF-EGCG composite hydrogels. Scale bar = 100 μm. (c) Equilibrium swelling ratio of the SF-T and SF-T/SF-EGCG composite hydrogels incubated in PBS for 24 h and (d) their weight loss profile in PBS over 21 days. (Mean ± SD, n = 7, **: p < 0.01, ***: p < 0.001). ATR-FTIR spectra of the hydrogels on (e) day 1 and (f) day 9. The dashed lines indicate the amide I band of fibroin β-sheet (1624 cm− 1) and the amide I band of fibroin random coil (1650 cm− 1)

