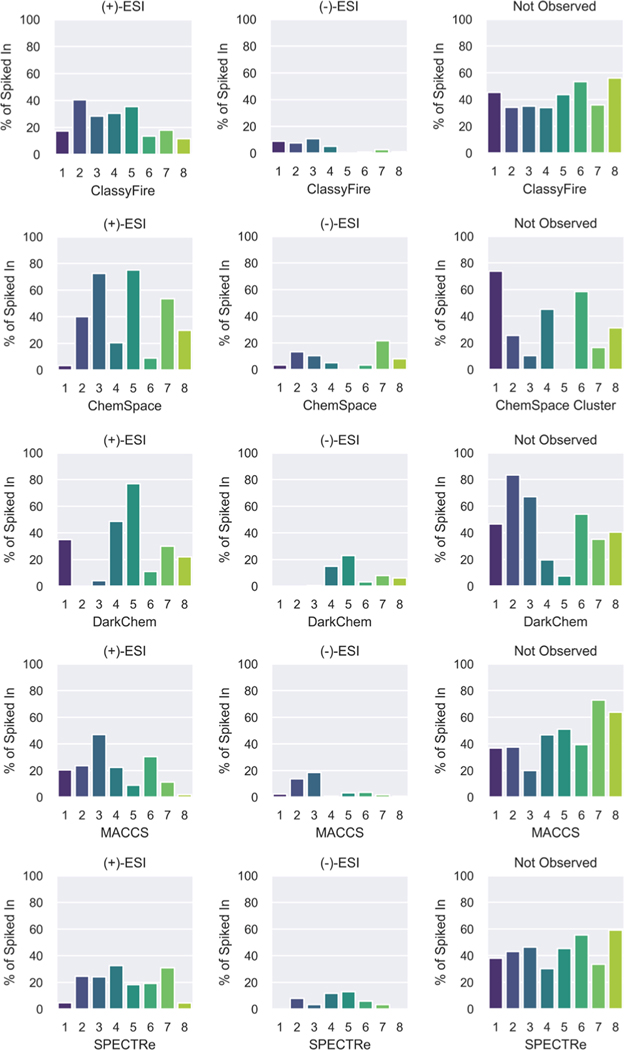
Figure 3. Distribution of spiked in compounds observed using positive vs. negative mode ESI, and the distribution of those that were not observed in any sample.
Compounds were split into groups by ClassyFire superclass groups, ChemSpace clusters, DarkChem clusters, and substructure (MACCS and SPECTRe) clusters.

