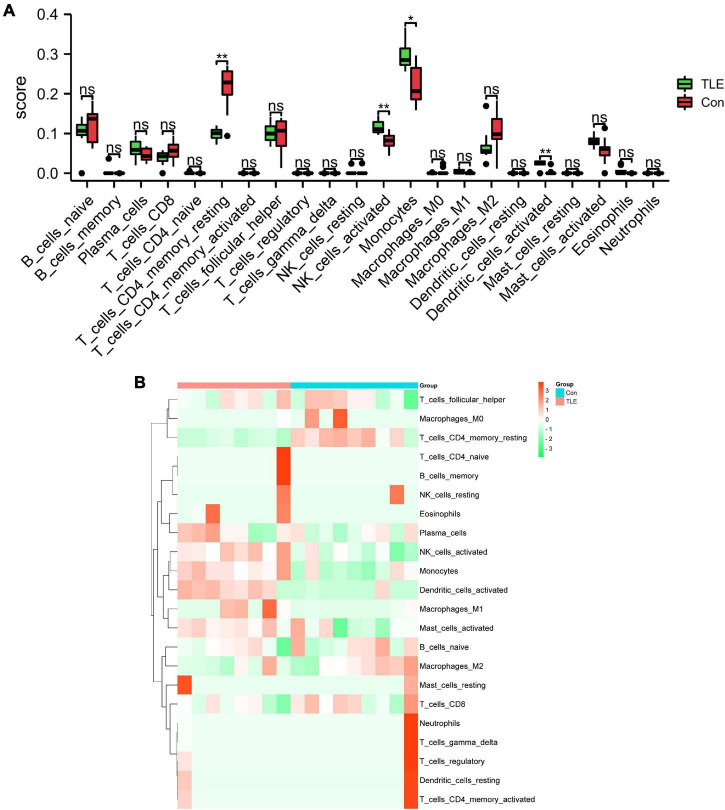
FIGURE 6.
Analysis of immune cell infiltration landscape in TLE. (A) The histogram exhibits the differences in the score of the 22 types of immune cells between the control and TLE group in GSE88992 dataset. (B) Heatmap exhibited distribution of 22 types of immune cells between the control and TLE group in GSE88992 dataset. *P < 0.05, **P < 0.01.

