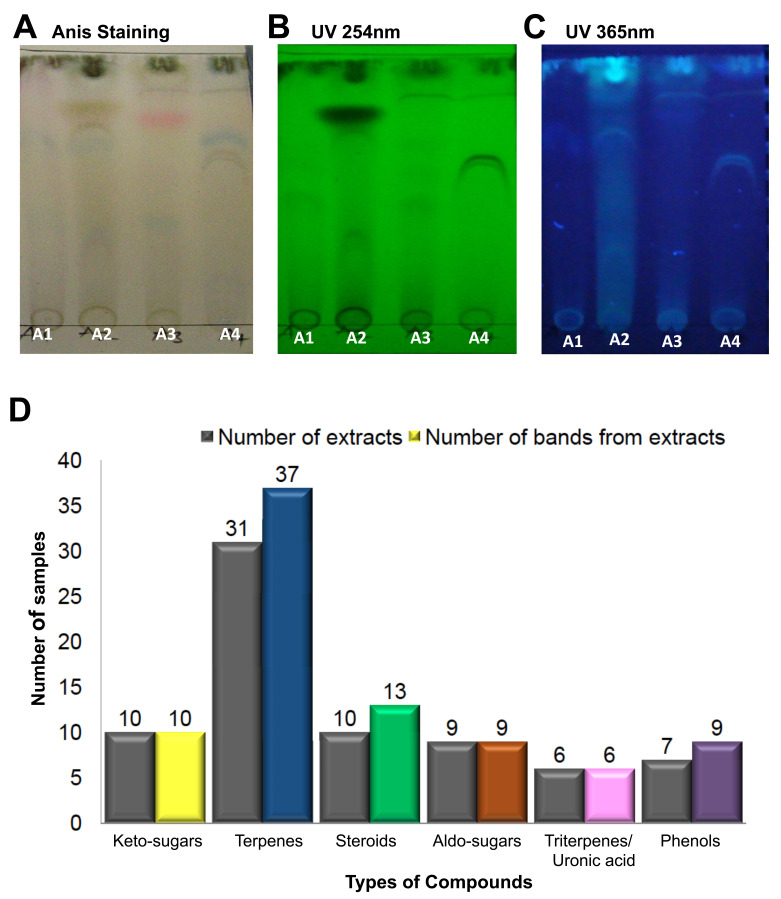
Figure 5. Diversity and distribution of compounds on the anisaldehyde-stained thin-layer chromatography (TLC) plates.
The wood-decaying fungi (WDF) extracts A1, A2, A3 and A4 were run on TLC plates using the following solvent system as mobile phase; ethyl acetate: acetonitrile: petroleum ether (7:2:1). The TLC plates were visualized under UV and sprayed with anisaldehyde reagent in visible light. Examples of TLC plates showing the output of the various detection systems used in the analysis: ( A) Anisaldehyde staining ( B) UV 254 nm, ( C) UV 365 nm. ( D) The number of WDF extracts producing the indicated compounds (first bar) and the total number of individual colored bands produced by the WDF (second bar); the compound types are inferred from the corresponding colors.

