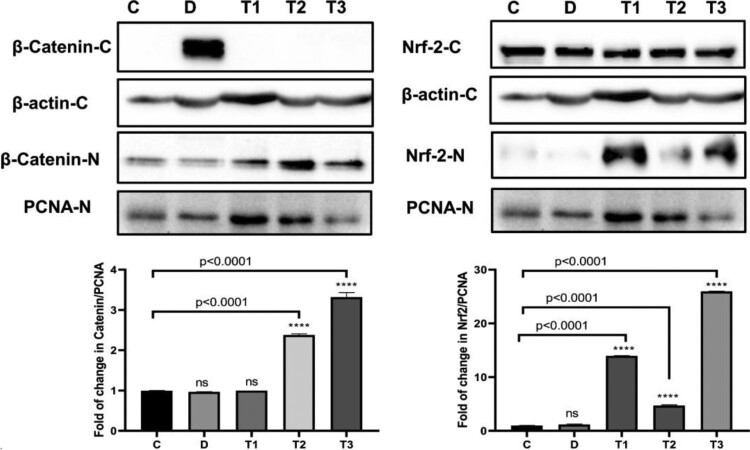
Figure 2.
Treatment of CKD rat model with ZnO-NP and SPL results in down-regulation of β-cateninin cytoplasm and up-regulation of Nrf2 in western blot analysis. Significant difference compared to *control group at p < 0.0001 where C: normal control group, D: CKD group, T1: SPL group, T2: ZnO-NPs group, T3: SPL + ZnO-NPs group.

