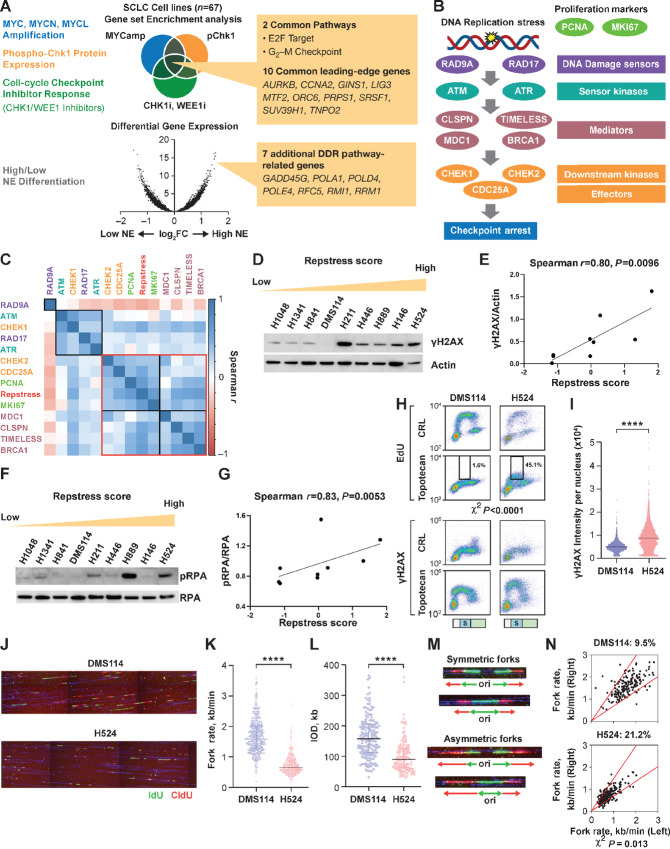
FIGURE 1.
Generation and in vitro functional validation of a repstress gene signature in SCLC cell lines. A, Schematic representation of the repstress gene signature derivation, which is based on four key characteristics associated with replication stress: (i) amplification of MYC paralogs; (ii) expression of p-Chk1; (iii) sensitivity with CHK1 and WEE1 inhibitors; and (iv) NE. B, Schematic representation highlighting key components of the replication stress response pathway The DNA damage sensors recruit kinases ATM and ATR that in turn phosphorylate mediators such as MDC1 and BRCA1 which sustain the DDR signaling. DDR signaling then engages downstream kinases CHK1 and CHK2 and eventually activates downstream effectors such as CDC25A phosphatases triggering transient cell-cycle arrest. C, Pairwise correlations between expression of DDR genes, proliferation markers PCNA and MKI67, and repstress score in 67 SCLC cell lines. Colors of gene name labels denote replication stress response functions indicated in B. Genes are clustered by Euclidean distance, using the complete-linkage clustering method, indicated with squares with black and red lines. Western blot analysis (D) and correlations (E) of γH2AX signal with repstress score in SCLC cell lines. SCLC cell lines are ordered from low to high repstress score (range: −1.2 to 1.8) from left to right in D. Western blot analysis (F) and correlations (G) of pRPA signal with repstress score in SCLC cell lines. SCLC cell lines are ordered from low to high repstress score (range: −1.2 to 1.8) from left to right in F. H and I, S-phase arrest and induction of γH2AX by exogenous replication stress by topotecan treatment in S-phase SCLC cell lines. EdU incorporation (top) and γH2AX induction (bottom) in SCLC cell lines with low (DMS114) and high repstress score (H524) are shown in H. Cell-cycle effects are defined by propidium iodide staining (Supplementary Fig. S5) and G1, S, G2–M phases are indicated on the bottom of the panels with light green, light blue with the letter of S, and light orange bars, respectively. Black squares indicate proportion of EdU incorporating S-phase cells, gated by cutoff of EdU signal intensity >1.0 × 10³. A comparison of quantified γH2AX signal intensity per nucleus with topotecan treatment in S-phase cells is shown in I. ****, P < 0.0001 by unpaired Student t test. J–L, DNA combing analysis of SCLC cell lines with low (DMS114) and high (H524) repstress scores. Representative images (J) and quantifications of replication fork speed (K) and interorigin distance (L) are shown. Green and red lines in J indicate IdU and CIdU, respectively. ****, P < 0.0001 by Mann–Whitney U test. Representative images (M) and quantification (N) of fork asymmetry in DNA combing analysis of SCLC cell lines with low (DMS114) and high (H524) repstress score Fork asymmetry was defined by >30% difference of fork speed between one direction with the other as described previously (25), indicating with a redline in N. The proportions of DNAs with fork asymmetry in each cell line were indicated on top of N. MYCamp, MYC amplification; WEEi1, WEE1 inhibitor; CHK1i, CHK1 inhibitor; p-Chk1, phosphorylated Chk1; Cont, control; PI, propidium iodide; CIdU, chlorodeoxyuridine; kb, kilobase; IOD, interorigin distance; ori, origin.

