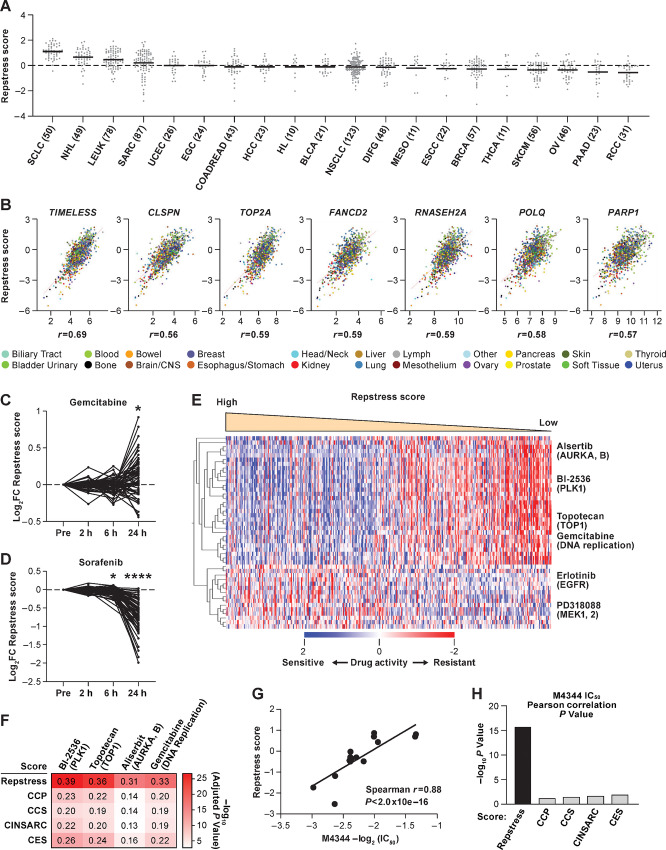
FIGURE 2.
Across cancer cell lines, repstress score profiles replication stress at a functional network level. A, Dot plot showing distribution of repstress score across 839 cancer cell lines from 20 cancer types represented in the CCLE. A black bar in each cancer type indicates the mean repstress score within each cancer type. Dashed line indicates zero of Z-normalized repstress score across all of cancer cell lines in CCLE. The numbers with cancer type labels on x-axis indicate the numbers of cell lines included. B, Across cancers, repstress score correlates with expression of representative genes involved in: (i) increasing replication stress tolerance by protecting replication forks (TIMELESS, CLSPN), (ii) solving topological problems during replication (TOP2A), (iii) facilitating the repair and restart of stalled replication forks (FANCD2), (iv) resolving barriers to replication fork progression (RNASEH2A), and (v) DNA damage repair factors (POLQ and PARP1). Correlations were analyzed in CellMiner CDB (16). Spearman correlation coefficients (r) are indicated. All of P values by Spearman correlation test are <0.0001. Dynamics of normalized repstress score with treatment of gemcitabine (C) and sorafenib (D) in NCI60 cell lines. Dynamics of gene expression pretreatment and posttreatment are retrieved from The NCI Transcriptional Pharmacodynamics Workbench (42). *, P < 0.05; ****, P < 0.0001 by Wilcoxon signed-rank test. For detailed method, please refer the Supplementary Materials and Methods. E, Heatmap of sensitive or resistant agents in cell lines with high versus low repstress score in the CTRP. Drug activity scores indicate calculated AUC over a 16-point concentration range using an automated, high-throughput workflow fitting concentration–response curves (43). The drug activity scores were retrieved from CellMiner CDB (16) and z score normalized in the heatmap. Cell lines are sorted by repstress score from high (left) to low (right). The heatmap shows 30 mostly sensitive compounds in high repstress score cell lines, and all of sensitive compounds in low repstress score cell lines with FDR of <5%. For detailed methods, please refer Supplementary Materials and Methods. F, Heatmap of Pearson correlations between gene signature scores and activities of drugs targeting replication stress. The color in each column indicates log-transformed P value of Pearson correlation between annotated gene signature score and drug activity score. The number in each column shows Pearson correlation coefficient between them. CCP, CCS, CINSARC, and CES scores are calculated as reported previously (39, 45–47). G, Correlations between half maximal inhibitory concentration (IC50) values of M4344 (an ATR-related inhibitor) and repstress score in different cancer type cell lines. The IC50 value of M4344 in different cancer type cell lines was examined in a previous report (48). H, Comparison of Spearman correlations between M4344 IC50 values and scores of repstress and other cell proliferation gene signatures. Each bar represents log-transformed P value of Spearman correlation between annotated gene signature and M4344 IC50 values. The IC50 value of M4344 in different cancer type cell lines is examined in a previous report (48). CCP, CCS, CINSARC, and CES scores are calculated as reported previously (39, 45–47). NHL, non–Hodgkin lymphoma; LEUK, leukemia; SARC, sarcoma; UCEC, uterine endometrioid cancer; EGC, esophagogastric adenocarcinoma; COADREAD, colorectal adenocarcinoma; HCC, hepatocellular carcinoma; HL, Hodgkin lymphoma; BLCA, bladder urothelial carcinoma; NSCLC, non–small cell lung cancer; DIFG, diffuse glioma; MESO, mesothelioma; ESCC, esophageal squamous cell carcinoma; BRCA, breast carcinoma; THCA, thyroid cancer; SKCM, skin melanoma; OV, ovarian cancer; PAAD, pancreatic adenocarcinoma; RCC, renal cell carcinoma; FC, fold change; hr, hour; AURKA, B, aurora kinase A and B; PLK1, polo-like kinase-1; TOP1, topoisomerase I; MAPK1, 2, mitogen-activated protein kinase kinase 1 and 2;CCP, cell-cycle progression; CCS, cell-cycle score; CINSARC, complexity index in sarcomas; CES, Centromere and kinetochore gene expression score.

