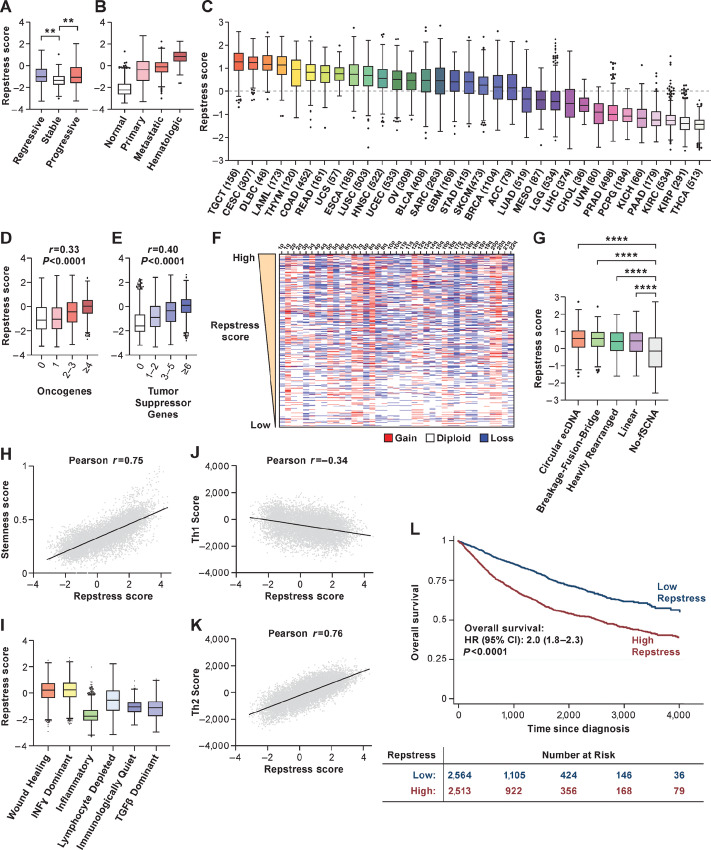
FIGURE 3.
Across cancer types, repstress score defines cancers characterized by genomic instability, immune evasion, and poor prognosis. A, Comparison of repstress score among bronchial premalignant lesions which regressed to normal tissue (regressive), did not change the premalignant histology (stable), and progressed to invasive malignancy (progressive) after biopsy. Gene expression data are obtained from a previous report (50). **, P < 0.01 by one-way ANOVA followed by Tukey multiple comparison test. B, Comparison of repstress score among TCGA normal tissue, primary and metastatic epithelial cancers, and hematopoietic malignancies P < 0.0001 by comparing repstress scores in normal tissues versus primary and metastatic epithelial cancers, and hematologic malignancies; and comparing those in hematologic malignancies versus primary cancer and metastatic cancers; whereas P > 0.05 comparing those in primary and metastatic epithelial cancers. P values are analyzed by one-way ANOVA followed by Tukey multiple comparison test. C, Distribution of repstress scores across 33 cancer types in TCGA The number in the x-axis label indicates the number of tumors included in each cancer type. A dash line indicates zero of Z-normalized repstress score across all of tumors in TCGA. Pan-cancer analysis showing the relationship between repstress score with the number of mutated oncogenes (D) and tumor suppressor genes (E; ref. 54). Spearman correlation coefficient (r) and P values are indicated on top of each panel. Hypermutated tumors (i.e., mutational burden of ≥ 50 mutations per megabase) are excluded. F, Copy-number alteration heatmap sorted by high (top) to low (bottom) repstress score. Chromosome with copy-number deletion or gain are indicated with blue and red, respectively. Copy-number alteration data in TCGA tumors are retrieved from a previous report (81). G, Comparison of repstress scores among tumors with amplicons of circular ecDNA, breakage-fusion-bridge, heavily rearranged, linear, and no focal somatic copy-number amplification Annotations of amplification for each tumor in TCGA are reported previously (55). ****, P < 0.0001 by one-way ANOVA followed by Tukey multiple comparison test. H, Correlation between cancer stemness score and repstress score. Cancer stemness score is derived by integrative transcriptome- and methylation-based analysis (57). The P value of Pearson correlation is <0.0001. I, Comparison of repstress score across six distinct TCGA immune subtypes, derived by gene signature–based clustering approach. Immune subtypes are described previously (58). P < 0.0001 by comparing repstress score in wound healing group versus the others; IFNγ dominant group versus the others; and inflammatory versus the others, respectively. P values are analyzed by one-way ANOVA followed by Tukey multiple comparison test. Correlations between Th1 (J) and Th2 (K) scores, and repstress score across cancer types Th1 and Th2 scores are available in a previous report (58). The P values of Pearson correlation are <0.0001 in J and K. L, OS in patients with cancer with high versus low repstress score. High versus low repstress scores are defined as patients whose cancers have repstress score ≥75th or <25th percentiles across TCGA tumors. P value is derived from the log-rank test. TCGA: The Cancer Genome Atlas; fSCNA: focal somatic copy-number alteration; CI, confidence interval. Abbreviations for cancer types in TCGA are available from https://gdc.cancer.gov/resources-tcga-users/tcga-code-tables/tcga-study-abbreviations.

