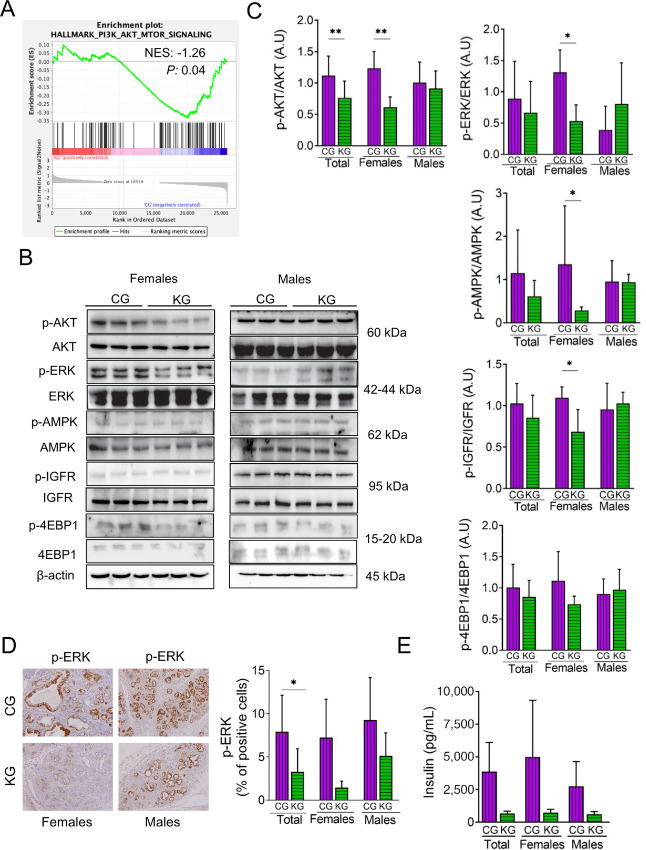
FIGURE 4.
A KG reduces AKT and ERK activation in KPC mice. A, GSEA was conducted on RNA-seq data obtained from pancreatic tumors of KG- and CG-treated KPC mice. The enrichment plot for the PI3K_AKT_MTOR gene set downregulated by KG treatment (relative to CG) is depicted. Normalized enrichment score (NES) and nominal P value (P) were provided according to GSEA B: Immunoblots of p-AKT, AKT, p-ERK, ERK, p-AMPK, AMPK, p-IGFR, IGFR, p-4EBP1, and 4EBP1 in pancreatic tumor homogenates isolated from CG- and KG-treated KPC mice following 2 months of treatment. Loading control: β-actin. C, Bands were quantified and results are expressed as % control; *, P < 0.05; **, P < 0.01. D, IHC for p-ERK were performed on KPC tumor sections and photographs were taken at 20 × magnification Representative images are shown. Results were expressed as percent of p-ERK+ cells ± SD per × 20 field. *, P < 0.05. E, Insulin levels were measured in serum obtained from KPC mice fed a CG or KG for 2 months.

