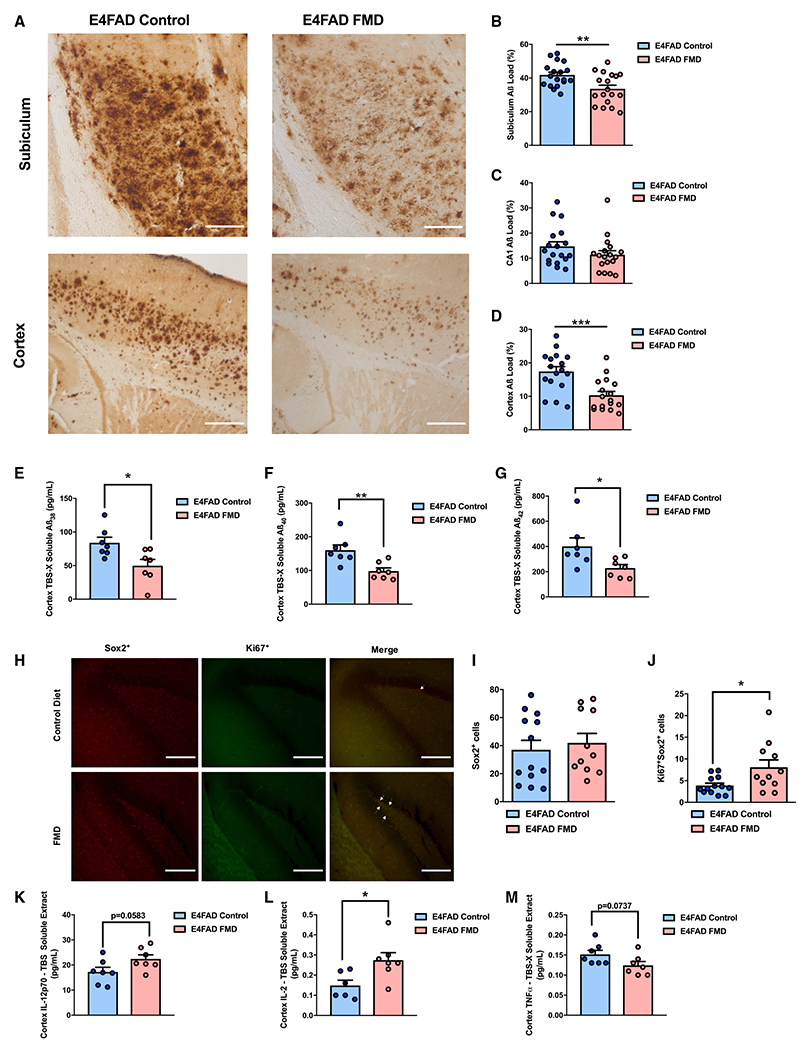
Figure 2. FMD cycles reduce hippocampal and cortex Aβ load, Aβ peptides, and neuroinflammatory cytokines, while increasing hippocampal neurogenesis markers in E4FAD mice.

(A) Representative images showing Aβ immunoreactivity in subiculum and cortical regions of female E4FAD control and FMD groups.
(B) Quantification of subiculum Aβ load (%) for female E4FAD control (n = 18) and FMD (n = 18) groups.
(C) Quantification of CA1 Aβ load (%) for female E4FAD control (n = 18) and FMD (n = 18) groups.
(D) Quantification of cortex Aβ load (%) for female E4FAD control (n = 17) and FMD (n = 17) groups.
(E) Quantification of triton-soluble Aβ38 for female E4FAD control (n = 7) and FMD (n = 7) groups.
(F) Quantification of triton-soluble Aβ40 for female E4FAD control (n = 7) and FMD (n = 7) groups.
(G) Quantification of triton-soluble Aβ42 for female E4FAD control (n = 7) and FMD (n = 7) groups.
(H) Representative images showing Sox2+, Ki67+, and co-stain hippocampal immunohistochemistry for ~7–7.5-month-old female E4FAD control and FMD groups. White arrows indicate the Ki67+/Sox2+ foci.
(I) Quantification of ~7–7.5-month-old E4FAD female Sox2+ (control [n = 13] and FMD [n = 11]) cells in the dentate gyrus (DG) after ~4 months of FMD cycles.
(J) Quantification of ~7–7.5-month-old E4FAD female Ki67+Sox2+ (control [n = 13] and FMD [n = 11]) cells in the DG after ~4 months of FMD cycles.
(K) Quantification of IL-2p70 in TBS-soluble cortex extract in control (n = 7) and FMD (n = 7) ~7–7.5-month-old female E4FAD mice.
(L) Quantification of IL-2 in TBS-soluble cortex extract in control (n = 6) and FMD (n = 7) ~7–7.5-month-old female E4FAD mice.
(M) Quantification of TNFα in detergent-soluble/triton-soluble cortex extract in control (n = 7) and FMD (n = 7) ~7–7.5-month-old female E4FAD mice. Data are presented as mean ± SEM. *p < 0.05, **p < 0.01, and ***p < 0.001, unpaired two-tailed Student’s t test. Images were taken at 20× magnification. Scale bar, 100 μm.
