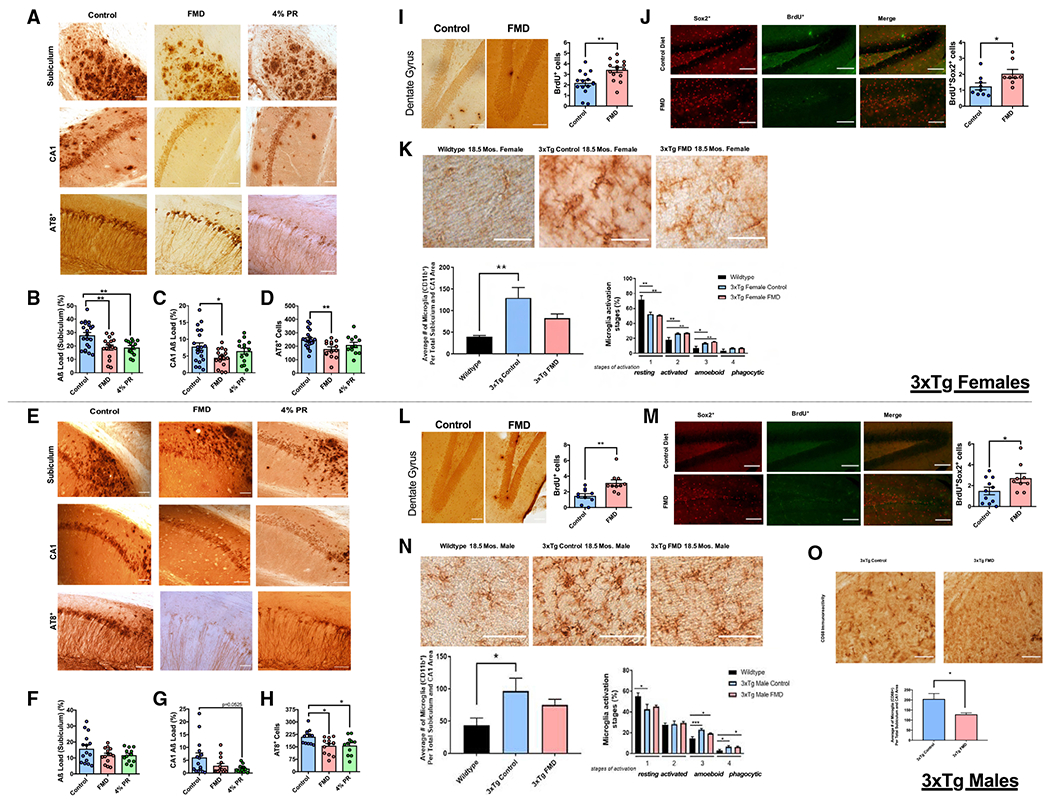
Figure 4. FMD cycles slow the progression of AD-associated pathology, increase levels of hippocampal neurogenesis markers, and regulate microglia levels and activation in aged 3xTg mice.

(A) Representative images showing Aβ immunoreactivity and AT8-positive neurons (recognizes abnormally phosphorylated tau) in subiculum or CA1 hippocampus regions of female control, FMD, and 4% PR 3xTg mice.
(B) Quantification of subiculum Aβ load (%) for female 3xTg control (n = 21), FMD (n = 16), and 4% PR (n = 14) mice.
(C) Quantification of CA1 Aβ load (%) for female 3xTg control (n = 20), FMD (n = 16), and 4% PR (n = 14) mice.
(D) Quantification of AT8+ neurons in the subiculum and CA1 for female 3xTg control (n = 20), FMD (n = 14), and PR (n = 12) mice.
(E) Representative images showing Aβ immunoreactivity and AT8+ neurons in subiculum or CA1 hippocampus regions of male 3xTg control, FMD, and 4% PR mice.
(F) Quantification of subiculum Aβ load (%) for male 3xTg control (n = 15), FMD (n = 14), and 4%PR (n = 12) mice.
(G) Quantification of CA1 Aβ load (%) for male 3xTg control (n = 15), FMD (n = 14), and 4%PR (n = 12) mice.
(H) Quantification of AT8+ neurons in the subiculum and CA1 for male 3xTg control (n = 12), FMD (n = 13), and 4%PR (n = 11) mice.
(I) Representative images showing BrdU+ DAB-immunohistochemistry in DG of hippocampus for 18.5-month-old female 3xTg control and FMD groups (left). Quantification of BrdU+ cells within the SGZ and inner third of the granule cell layer of the DG for 18.5-month-old female 3xTg control (n = 15) and FMD (n = 15) groups (right).
(J) Representative images showing Sox2+, BrdU+, and co-stain hippocampal immunohistochemistry for 18.5-month-old female 3xTg control and FMD groups (left). Quantification of 18.5-month-old 3xTg female BrdU+Sox2+ (control [n = 9] and FMD [n = 8]) cells within the SGZ and inner third of the granule cell layer of the DG after ~15 months of FMD cycles (right).
(K) Representative images showing CD11b-ir microglia in hippocampus sections of 18.5-month-old female C57B/6 WT, 3xTg control, and 3xTg FMD mice (top). Quantification of density of CD11b-ir cells in hippocampus CA1 and subiculum combined brain regions of C57B/6 WT, 3xTg control, and 3xTg FMD groups (bottom left; n = 5–7 animals per group). Percentage of different microglia activation stages (from 1 to 4) of C57B/6 WT, 3xTg control, and 3xTg FMD mice (bottom right; n = 5–7 animals per group).
(L) Representative images showing BrdU+ DAB-immunohistochemistry in DG of hippocampus for 18.5-month-old male 3xTg control and FMD groups (left). Quantification of BrdU+ cells within the SGZ and inner third of the granule cell layer of the DG for 18.5-month-old male 3xTg control (n = 10) and FMD (n = 10) groups (right).
(M) Representative images showing Sox2+, BrdU+, and co-stain hippocampal immunohistochemistry for 18.5-month-old male 3xTg control and FMD groups (left). Quantification of 18.5-month-old 3xTg male BrdU+Sox2+ (control [n = 11] and FMD [n = 9]) cells within the SGZ and inner third of the granule cell layer of the DG after ~15 months of FMD cycles (right).
(N) Representative images showing CD11b-ir microglia in hippocampus sections of 18.5-month-old male C57B/6 WT, 3xTg control, and 3xTg FMD mice (top). Quantification of density of CD11b-ir cells in hippocampus CA1 and subiculum combined brain regions of C57B/6 WT, 3xTg control, and 3xTg FMD (bottom left; n = 5–8 animals per group). Percentage of different microglia activation stages (from 1 to 4) of C57B/6 WT, 3xTg control, and 3xTg FMD mice (bottom right; n = 5–8 animals per group).
(O) Representative images showing CD68+ microglia in hippocampus sections of 18.5-month-old male 3xTg control and 3xTg FMD mice (top; n = 2–3 animals per group). Quantification of density of CD68+ cells in hippocampus CA1 and subiculum combined brain regions of 3xTg control and 3xTg FMD (bottom; n = 2–3 animals per group. Data are presented as mean ± SEM. (B–D and F–H) *p < 0.05 and **p < 0.01, one-way ANOVA. (I–O) *p < 0.05 and **p < 0.01, unpaired two-tailed Student’s t test. Images were taken at 20× magnification. Scale bar, 100 μm.
