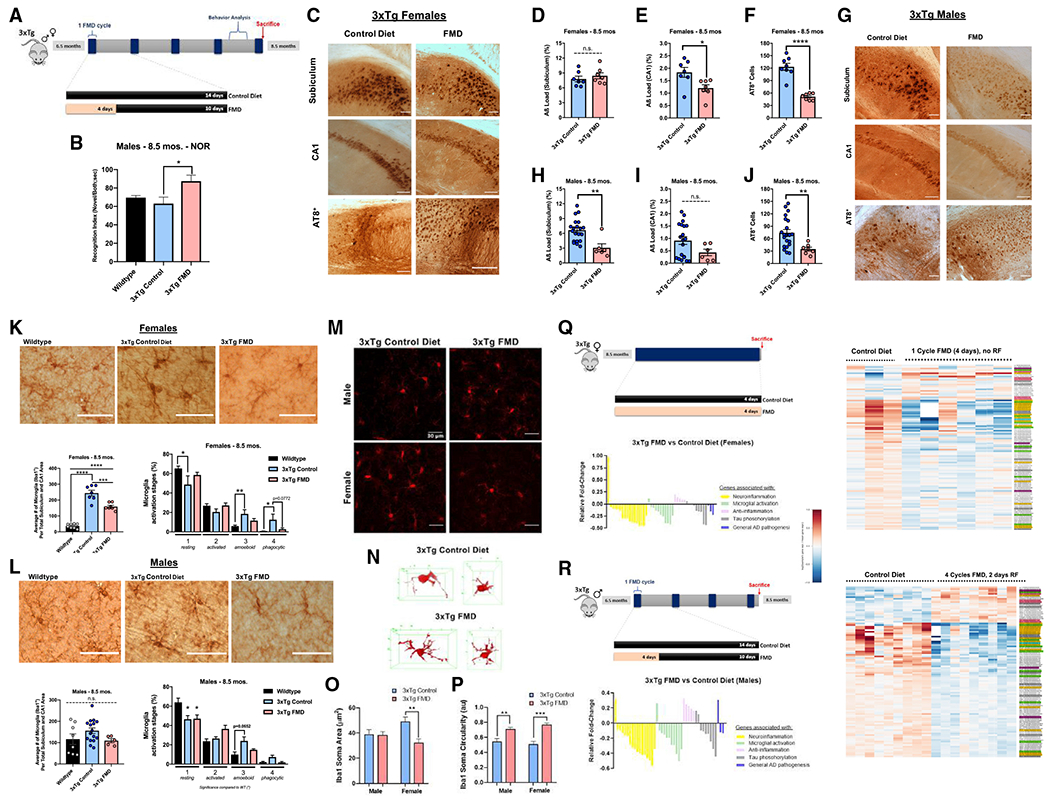
Figure 5. Short-term treatment with FMD cycles improves memory, mitigates pathology progression, reduces microglia activation, and reduces the expression of neuroinflammation genes, microglial activation, and reduced tau phosphorylation in 3xTg mice.

(A) Experimental diet and behavior schedule for 3xTg males and females starting at 6.5 months of age through approximately 8.5 months of age for five FMD cycles.
(B) RI for trial 2 of NOR task for 8.5-month-old C57B/6 WT males (n = 8) and 8.5-month-old 3xTg male control (n = 10) and FMD after four cycles of FMD and 7 days of refeeding (n = 5).
(C) Representative images showing subiculum and CA1 Aβ immunoreactivity and AT8+ neurons in hippocampus for 8.5-month-old 3xTg female control and FMD groups.
(D) Quantification of subiculum Aβ load (%) for 3xTg female control (n = 7) and FMD (n = 7) groups.
(E) Quantification of CA1 Aβ load (%) for 3xTg female control (n = 7) and FMD (n = 7) groups.
(F) Quantification of AT8+ neurons in the subiculum and CA1 for 3xTg female control (n = 8) and FMD (n = 8) groups.
(G) Representative images showing subiculum and CA1 Aβ immunoreactivity and AT8+ neurons in hippocampus for 8.5-month-old 3xTg male control and FMD groups.
(H) Quantification of subiculum Aβ load (%) for 3xTg male control (n = 20) and FMD (n = 6) groups.
(I) Quantification of CA1 Aβ load (%) for 3xTg male control (n = 20) and FMD (n = 6) groups.
(J) Quantification of AT8+ neurons in the subiculum and CA1 for 3xTg male control (n = 21) and FMD (n = 7) groups.
(K) Representative images showing Iba1-stained microglia in hippocampus sections of 8.5-month-old female C57B/6 WT and 3xTg control and FMD groups (top). Quantification of density of Iba1+ microglia in the CA1 and subiculum hippocampus regions of C57B/6 WT females (n = 8) and 3xTg female control (n = 7) and FMD (n = 7) groups (bottom left). Percentage of different microglia activation stages (from 1, resting, to 4, most activated) of C57B/6 WT females (n = 8) and 3xTg female control (n = 7) and FMD (n = 7) groups (bottom right).
(L) Representative images showing Iba1-stained microglia in hippocampus sections of 8.5-month-old male C57B/6 WT and 3xTg control and FMD groups (top). Quantification of density of Iba1+ microglia in the CA1 and subiculum hippocampus regions of C57B/6 WT males (n = 8) and 3xTg male control (n = 16) and FMD (n = 5) groups (bottom left). Percentage of different microglia activation stages (from 1, resting, to 4, most activated) of C57B/6 WT males (n = 8) and 3xTg male control (n = 16) and FMD (n = 5) groups (bottom right).
(M) Representative images of confocal stack immune reactive for Iba1 microglia (red) in the prefrontal cortex for male and female 3xTg control diet and FMD cohorts. Scale bars, 100 μm.
(N) Example 3D skeletonized microglial projections for 3xTg control diet and 3xTg FMD cohorts.
(O and P) Quantification of Iba1 immuno-reactive soma area (O) and circularity (P) in male (M) and female (F) 3×Tg mice with control diet (open bars) and FMD (filled bars) from high-magnification images (n = 2/group).
(Q) Experimental timeline and gene expression (top left and right) in cortex samples of 8.5-month-old female 3xTg controls (n = 3) and 3xTg females after one 4-day cycle of FMD, with no refeeding (n = 6). Yellow-, green-, blue-, rose-, gray-, and lavender-highlighted gene names in heatmap correspond with genes associated with neuroinflammation, microglial activation, neuroinflammation and microglial activation, anti-neuroinflammation, tau phosphorylation, and general association with AD pathogenesis, respectively. Relative fold change (Log2-transformed fold-change values, centered at 0) of gene expression in FMD group versus control diet group (bottom left) for genes associated with neuroinflammation, microglial activation, anti-neuroinflammation, tau phosphorylation, and general association with AD pathogenesis. Values in histogram were calculated from fold change in Table S1. “0” value is equivalent to no change between FMD group and control diet group.
(R) Experimental timeline and gene expression (top left and right) in cortex samples of 8.5-month-old male 3xTg controls (n = 9) and 3xTg males after four cycles of FMD and 2 days of refeeding (n = 9). Yellow-, green-, blue-, rose-, gray-, and lavender-highlighted gene names in heatmap correspond with genes associated with neuroinflammation, microglial activation, neuroinflammation and microglial activation, anti-neuroinflammation, tau phosphorylation, and general association with AD pathogenesis, respectively. Relative fold change (Log2-transformed fold-change values, centered at 0) of gene expression in FMD group versus control diet group (bottom left) for genes associated with neuroinflammation, microglial activation, anti-neuroinflammation, tau phosphorylation, and general association with AD pathogenesis. Values in histogram were calculated from fold change in Table S1. “0” value is equivalent to no change between FMD group and control diet group. Data are presented as mean ± SEM. (B) *p < 0.05, compared with WT; one-way ANOVA followed by Tukey’s multiple comparisons test. (D-F and H-J) *p < 0.05, **p < 0.01, ****p < 0.0001; unpaired two-tailed student’sttest. (K and L) *p < 0.05, **p < 0.01, ***p < 0.001, and ****p < 0.0001; one-way ANOVA followed by Tukey’s multiple comparisons test. (M-P) Two mice were analyzed per group, n = 20–35 cells per group. **p < 0.01, ***p < 0.001; two-way ANOVA followed by Tukey’s multiple comparisons test. Images were taken at 20× magnification unless otherwise noted. Scale bar, (C, G, K, L) 100 μm and (G) 30 μm. RNA-seq libraries were sequenced 1 × 50 bp on an Illumina HiSeq3000 system
