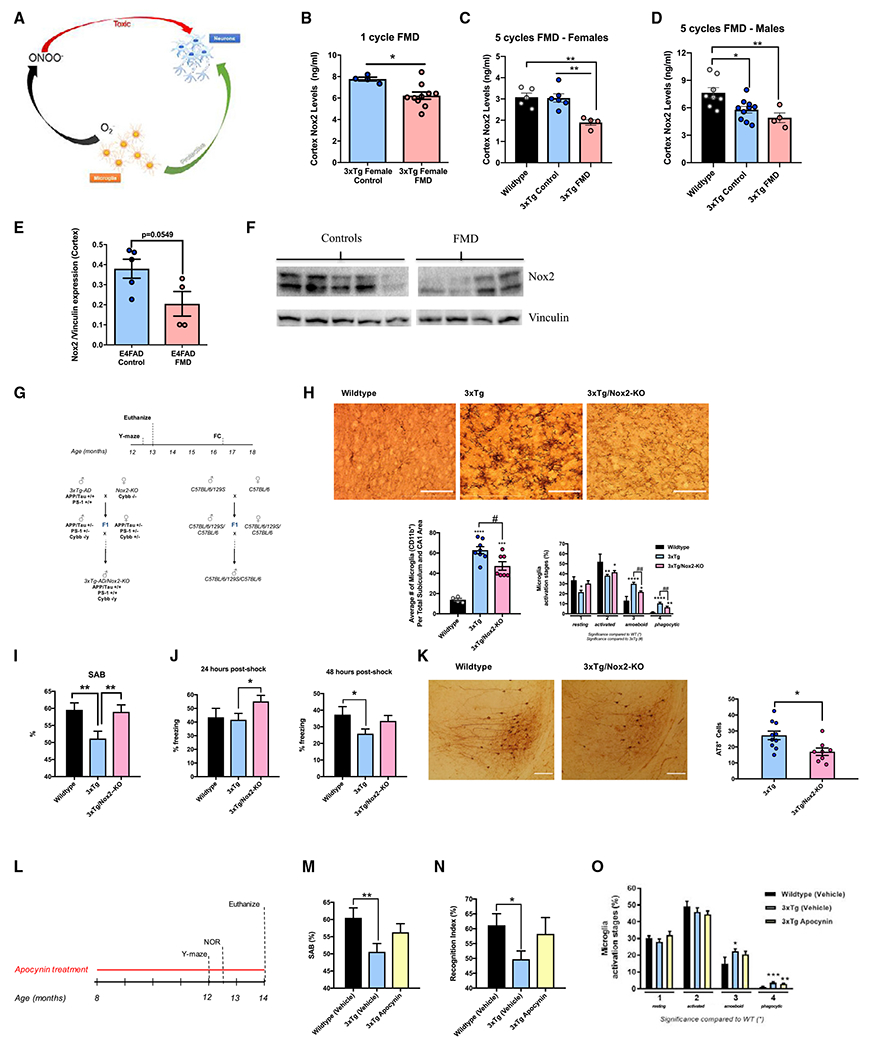
Figure 6. Short-term cycles of FMD regulate Nox2 cortex levels in 3xTg and E4FAD mice, while NOX2 deletion or inhibition improves cognitive behavior, mitigates pathology progression, and reduces microglia activation.

(A) Diagram describing the dual positive and negative function of microglia. Microglia are involved in neuronal development and repair, but their production of O2− into ONOO− can promote toxicity and lead to neurodegeneration.
(B) Quantification of Nox2 (ng/mL) in cortex extract of 8.5-month-old female 3xTg controls (n = 4) and 3xTg females after one 4-day cycle of FMD with no refeeding (n = 10).
(C) Quantification of Nox2 (ng/mL) in cortex extract of 8.5-month-old female C57B/6 WT (n = 5) and 8.5-month-old 3xTg female control (n = 6) and FMD after five cycles of FMD and no refeeding after last cycle (n = 4) groups.
(D) Quantification of Nox2 (ng/mL) in cortex extract of 8.5-month-old male C57B/6 WT (n = 8) and 8.5-month-old 3xTg male control (n = 10) and FMD after five cycles of FMD and no refeeding after last cycle (n = 4) groups.
(E) Quantification of Nox2 levels in cortex extract of control (n = 5) and FMD (n = 4) ~7-7.5-month-old female E4FAD mice after 4 months of biweekly FMD cycles (measured as Nox2/Vinculin protein expression levels).
(F) Western blot image used for quantifying Nox2 levels in whole-cortex extract of control (n = 5) and FMD (n = 4) ~7- to 7.5-month-old female E4FAD mice. Vinculin was loading control (bottom).
(G) 3xTg/Nox2-KO mice generation and experimental design. The experimental design of the tests conducted on 3xTg/Nox2-KO and control mice is depicted, as well as a schematic representation of the breeding strategy used to develop 3xTg/Nox2-KO mice and corresponding WT (mixed background 129/B6/B6). Some mice were euthanized for pathology at 13–14 months, while those used for fear-conditioning (FC) tests were aged until 15–18 months.
(H) Representative images showing CD11b-ir microglia in hippocampus sections of 13- to 14-month-old male WT (129/B6 background), 3xTg, and 3xTg/Nox2-KO mice (top). Quantification of density of CD11b-ir cells in hippocampus CA1 and subiculum combined brain regions of WT (129/B6 background), 3xTg, and 3xTg/Nox2-KO (bottom left; n = 4–8 animals per group). Percentage of different microglia activation stages (from 1 to 4) of WT (129/B6 background), 3xTg, and 3xTg/Nox2-KO mice (bottom right; n = 4–8 animals per group).
(I) WT (129/B6 background), 3xTg, and 3xTg/Nox2-KO male mice were tested with the Y-maze apparatus (12.5 months of age). SAB scores obtained through Y-maze task are shown (n = 7–23 per group).
(J) WT (129/B6 background), 3xTg, and 3xTg/Nox2-KO male mice (15–18 months of age) FC tests. Freezing times (%) 24-h post shock for FC are shown (n = 6–22 per group) (left). WT (129/B6 background), 3xTg, and 3xTg/Nox2-KO male mice (15–18 months of age) underwent FC tests. Freezing times (%) 48-h post shock for FC are shown (n = 6–22 per group) (right).
(K) Representative images showing AT8 antibody (recognizes abnormally phosphorylated tau) immunoreactivity in hippocampus of 13- to 14-month-old male 3xTg and 3xTg/Nox2-KO mice (left). Quantification of total AT8-immuno-reactive cells in hippocampus of 13- to 14-month-old male 3xTg and 3xTg/Nox2-KO mice (n = 10–13/group) (right).
(L) Experimental design of apocynin treatment. Eight-month-old WT (129/B6 background) and 3xTg mice were treated with apocynin-dissolved drinkable water or apocynin-free water for 6 months. During the final 4 weeks of treatment, the animals were tested using the Y-maze apparatus, and NOR and Rotarod assays. After completion of the behavioral tasks, the mice were euthanized and their brains analyzed.
(M) Comparison of SAB scores between WT (129/B6 background) vehicle, 3xTg vehicle, and 3xTg apocynin-treated mice using the Y-maze apparatus (n = 10–13 animals per group).
(N) Comparison of RI values between WT (129/B6 background) vehicle, 3xTg vehicle, and 3xTg apocynin- treated mice during NOR test (n = 10–13 animals per group).
(O) Percentage of different microglia activation stages (from 1 to 4) of WT (129/B6 background) vehicle, 3xTg vehicle, and 3xTg apocynin-treated mice (n = 5–10 animals/group). Data are presented as mean ± SEM. (H and O) *p < 0.05, **p < 0.01, ***p < 0.001 compared with WT; #p < 0.05, ##p < 0.01 for 3xTg/Nox2-KO versus 3xTg, one-way ANOVA followed by Tukey’s multiple comparisons test (H, bottom left) and Fisher’s least significant difference test (H, bottom right, and O). (B, E, and K) *p < 0.05, unpaired two-tailed student’s t test. (C and D) *p < 0.05, **p < 0.01, ***p < 0.001 compared with WT; one-way ANOVA followed by Tukey’s multiple comparisons test. (I, J, M, and N) *p < 0.05, **p < 0.01, ***p < 0.001; one-way ANOVA followed by Fisher’s least significant difference test. Images were taken at 20× magnification. Scale bar, 100 μm.
