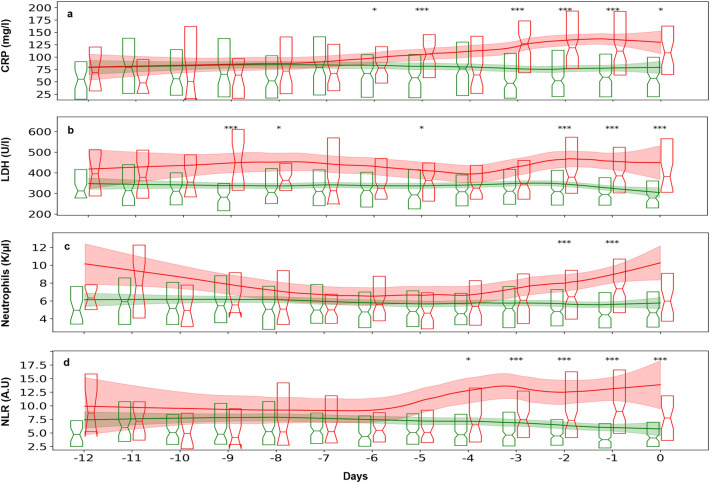
Figure 1.
Longitudinal measurements of blood parameters in mild and moderate patients who would deteriorate and in those who would not deteriorate. Patients with COVID-19, collected in Sheba Medical Center, were aligned to t = 0 by the day of their first deterioration from a mild or moderate status to a severe status (red), or by the end of follow-up for patients who did not deteriorate (green). Summary boxplots, show 25th, 50th, and 75th percentiles of pooled daily (a) CRP values of 581 continually non-severe and 207 potentially severe patients, (b) LDH values of 591 non-severe and 206 severe patients, (c) absolute neutrophil counts of 595 non-severe and 208 severe patients, (d) NLR values of 595 non-severe and 208 severe patients. Locally Weighted Scatterplot Smoothing (lowess), with 95% confidence intervals are shown in continuous lines and light bands around them. Asterisks represent the level of significance of the differences between the daily status groups, determined by the p-values of the Kruskall-Wallis test, *< 0.05, **< 0.01, ***< 0.001. The test for difference was applied to the values collected at each day, separately (e.g., test whether the values between − 24 h and 0 are different, test whether the values between − 48 and − 24 h are different, etc.).

