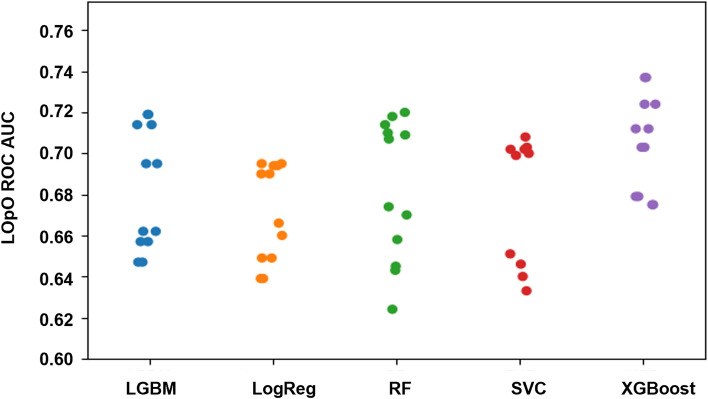
Figure 2.
Selection of the ML model. The model performance was estimated by Leave-one-patient-out cross-validation (LOpO CV) on the training set of the Sheba Medical Center cohort, comparing of the ROC AUC of 5 different ML models. Each dot stands for (1) a specific ML model, as marked on the abscissa, (2) a specific prediction scope (48 h or 96 h), and (3) a specific choice of the set of dynamic features. The density and location of the cloud, formed by the aggregation of dots for each ML model indicate the model robustness and accuracy.

