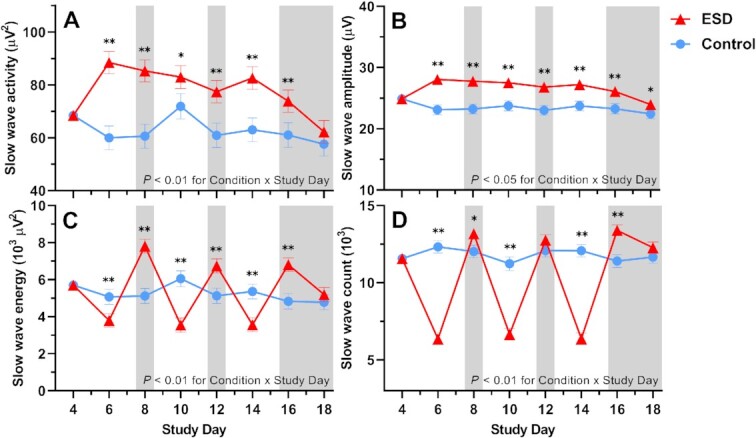
Fig. 3.

Effects of ESD on sleep depth. Data present estimated marginal means ± SEM based on GLMMs for (A) SWA, (B) slow wave amplitude, (C) SWE, and (D) slow wave count for the ESD condition (red lines) and the control condition (blue lines). The gray shaded area indicates recovery periods with an 8-hour sleep opportunity per night. **P < 0.01, *P < 0.05. n = 22–24.
