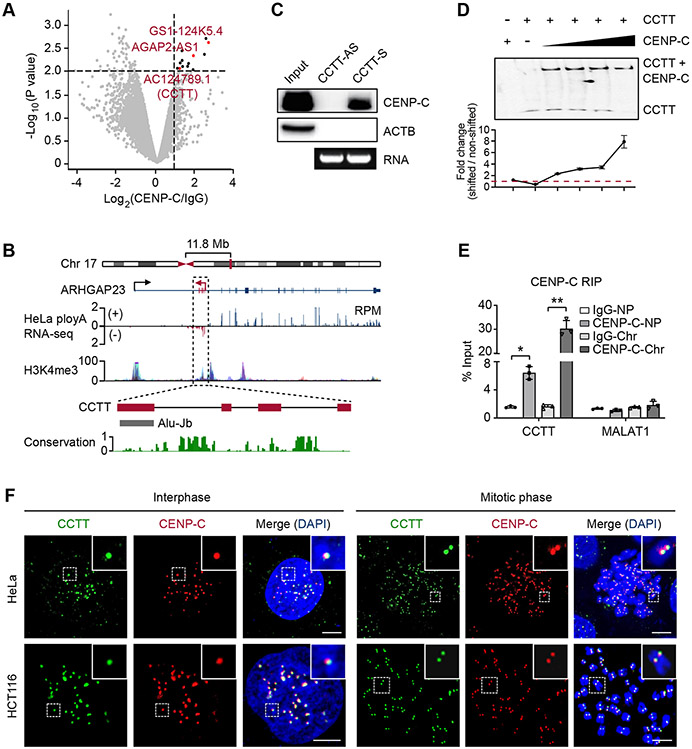
Figure 1. CENP-C Interacts with A New LncRNA CCTT.
(A) Volcano plot of CENP-C-binding transcripts in HeLa cells. Transcripts with over 2-fold enrichment relative to IgG (p < 0.01) are highlighted as red (lncRNAs) or black dots (mRNAs).
(B) Diagram of the CCTT locus. CCTT consists of 4 exons, with the last one harboring an Alu-Jb element. The coverage of ENCODE polyA RNA-seq and H3K4me3 ChIP-seq signals within the CCTT locus is prevalent in multiple human cell lines. The conservation score in 30 mammals is calculated by PhastCons.
(C) RNA pulldown with biotinylated sense or antisense CCTT transcripts from HeLa whole cell lysate followed by western blot analysis of CENP-C. The agarose gel shows the corresponding RNA of sense or antisense CCTT.
(D) CCTT interacted with CENP-C. Top: EMSA imaging of the biotinylated CCTT binding to increasing concentrations (2.5, 3.5, 4.5, 6 μM) of purified recombinant full-length CENP-C proteins. Gels were visualized and quantified by ChemiImager analysis. Bottom: quantification of the EMSA results. For each condition, the fraction of shifted RNA in each lane versus the amount of non-shifted RNA was plotted. Results are presented as the mean and SD of triplicate determinations. The dashed line indicates the shifted signal is same with the non-shifted signal.
(E) CENP-C RIP followed by qPCR analysis of CCTT in nucleoplasm (NP) and chromatin (Chr) fractions of HeLa cells. MALAT1 was used as a negative control. *p < 0.05; **p < 0.01 (mean ± SD, n = 3 per group).
(F) The co-localization of CCTT and CENP-C at centromeres. CCTT FISH (green) and CENP-C IF (red) analysis of HeLa (top) and HCT116 (bottom) cells in interphase and mitotic phases. Scale bars, 5 μm.
See also Figures S1-S2.

