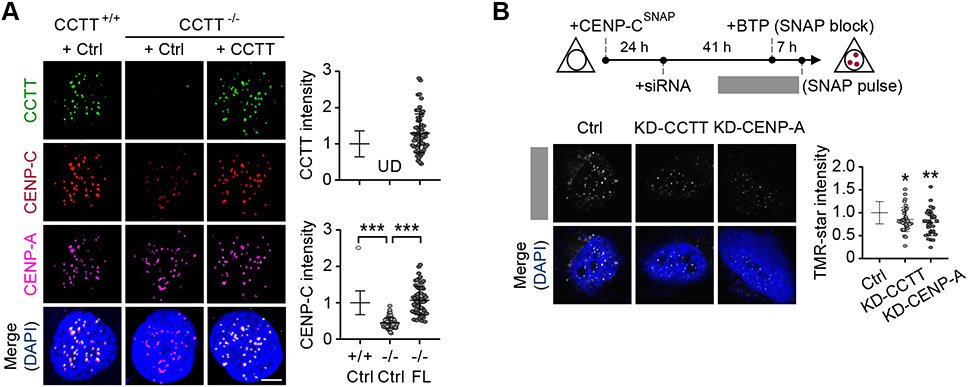
Figure 2. CCTT Recruits CENP-C to Centromeres.
(A) Re-expression of CCTT rescued CENP-C abundance at centromeres in CCTT−/− cells. Representative images of CCTT FISH (green), CENP-C (red) and CENP-A (pink) IF analyses of HeLa cells (left) and the quantifications of CCTT (top) or CENP-C (bottom) signals by IMARIS (right) are shown. n = 61 for CCTT+/+ cells, n = 72 for CCTT−/− cells, and n = 61 for CCTT−/− cells transfected with full-length (FL) CCTT. ***p < 0.001; UD, undetected (mean ± SD of three biological replicates). Scale bar, 5 μm. Each point represents an averaged fluorescence of all centromeres within a cell.
(B) CCTT knockdown (KD-CCTT) decreased the deposition of new CENP-C at centromeres. Top: The strategy to determine the role of CCTT in CENP-C recruitment. Bottom: TMR-star staining (white) represents the newly deposited CENP-C during 7-hours chasing period. The TMR-star signals were quantified by IMARIS. n = 34 for Ctrl cells, n = 34 for KD-CCTT cells, n = 32 for KD-CENP-A cells. The cells collected from one batch experiment. *p < 0.05; **p < 0.01 (mean ± SD of three biological replicates). Scale bar, 5 μm. Each point represents an averaged TMR-star signals of all centromeres within a cell.
See also Figures S2-S3.

