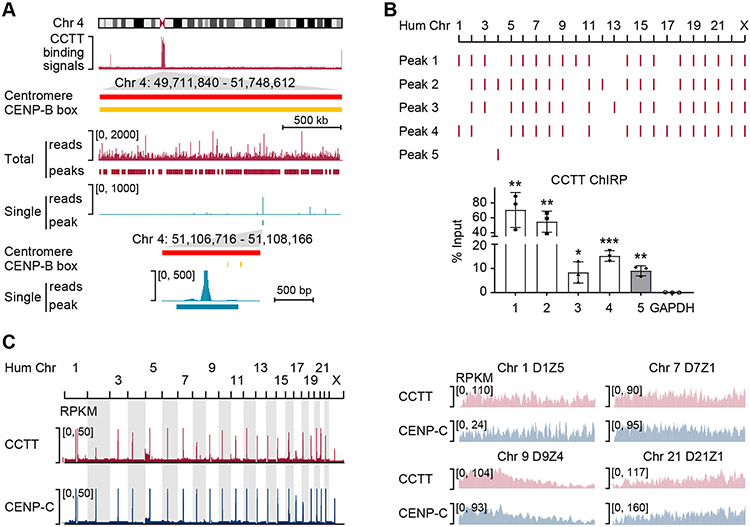
Figure 3. CCTT Binds to CenDNA.
(A) CCTT AMT-ChIRP-seq signals as well as SICER peaks across the centromere of Chr. 4. The middle two tracks separately show all mapped reads and deduced peaks (red) as well as single-mapped reads and deduced peaks (blue). The bottom panel further highlights the peak based on single-mapped reads in reference to annotated CENP-B boxes (yellow).
(B) AMT-ChIRP-qPCR validation of representative peaks deduced from genome-wide CCTT binding profile by AMT-ChIRP-seq. Four representative peaks (1-4) were based on total reads which were detectable in multiple centromeres, and the last peak (5) was deduced based on single reads uniquely localized in Chr. 4. The AMT-ChIRP-qPCR results are shown at the bottom. GAPDH served as a negative control. *p < 0.05; **p < 0.01; ***p < 0.001 (mean ± SD, n = 3 per group).
(C) Comparison between genome-wide binding profiles of CCTT and CENP-C. Mapped reads of CCTT AMT-ChIRP-seq and CENP-C ChIP-seq across all human chromosomes (left) and at different HORs within 4 representative centromeres (right) of HeLa cells. RPKM: reads per kb per million mapped reads.
See also Figure S4.

