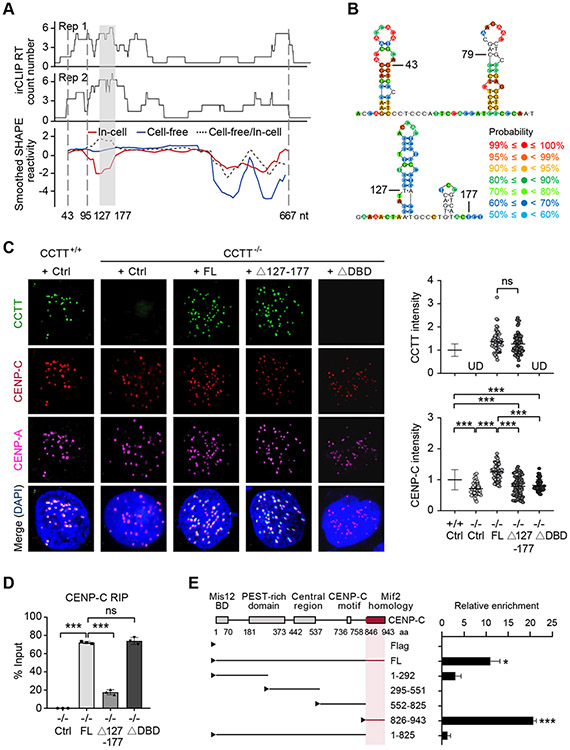
Figure 5. CCTT Uses Distinct Domains to Interact with CENP-C and CenDNA.
(A) The CENP-C binding domain of CCTT deduced by irCLIP (top two tracks from two biological replicates) and SHAPE-MaP (bottom track) in cell-free (blue line) or in-cell state (red line). The ratio of cell-free smoothened SHAPE reactivities relative to in-cell reactivities is indicated by the dotted line. The gray-shaded area (127-177 nt) indicates the region with the highest ratio of cell-free versus in-cell SHAPE reactivities, which is co-incident with the highest CENP-C binding detected by irCLIP. The sequence between the two vertical dotted lines (43-95 nt) corresponds to the region with most single-strandness predicted by SHAPE-MaP.
(B) The deduced secondary structures of the predicted single-strand region (top) and CENP-C binding domain (bottom) of CCTT. Color-coded probability scores at individual nucleotide positions are based on the SHAPE-MaP data and predicate the confidence probability of secondary structure. The predicated secondary structure contains paired and unpaired base, and the higher scores imply the more reliable structure in this position.
(C) Exogenous FL CCTT, but not the mutants depleted of the CENP-C binding domain (Δ127-177) or the DNA binding domain (ΔDBD), restored the abundance of CENP-C at centromeres in CCTT−/− HeLa cells, shown by CCTT FISH (green), CENP-C (red) and CENP-A (pink) IF analyses (left). The quantifications of CCTT (top) or CENP-C (bottom) signals by IMARIS (n = 77 for CCTT+/+ cells, n = 46 for CCTT−/− cells, n = 58 for CCTT−/− cells transfected with FL CCTT, n = 65 for CCTT−/− cells transfected with Δ127-177 CCTT, n = 51 for CCTT−/− cells transfected with ΔDBD) are shown (right). ***p < 0.001; ns, no significant difference; UD, undetected (mean ± SD of three biological replicates). Scale bar, 5 μm. Each point represents an averaged CCTT or CENP-C signals of all centromeres within a cell.
(D) Quantified results of captured CCTT by CENP-C RIP in CCTT−/− HeLa cells complemented with Ctrl, FL CCTT, Δ127-177 CCTT, or ΔDBD CCTT. ***p < 0.001; ns, no significant difference (mean ± SD, n = 3 per group).
(E) Mapping the specific CCTT binding domain in CENP-C by CENP-C RIP-qRT-PCR. Left: Annotated CENP-C domains in literature and various Flag-tagged CENP-C truncated mutants tested by the CCTT capture assay. The deduced CCTT binding domain in CENP-C is highlighted in red. Right: Quantification of the RIP-qRT-PCR data. *p < 0.05; ***p < 0.001 (mean ± SD, n = 3 per group).
See also Figure S5.

