Figure 2.

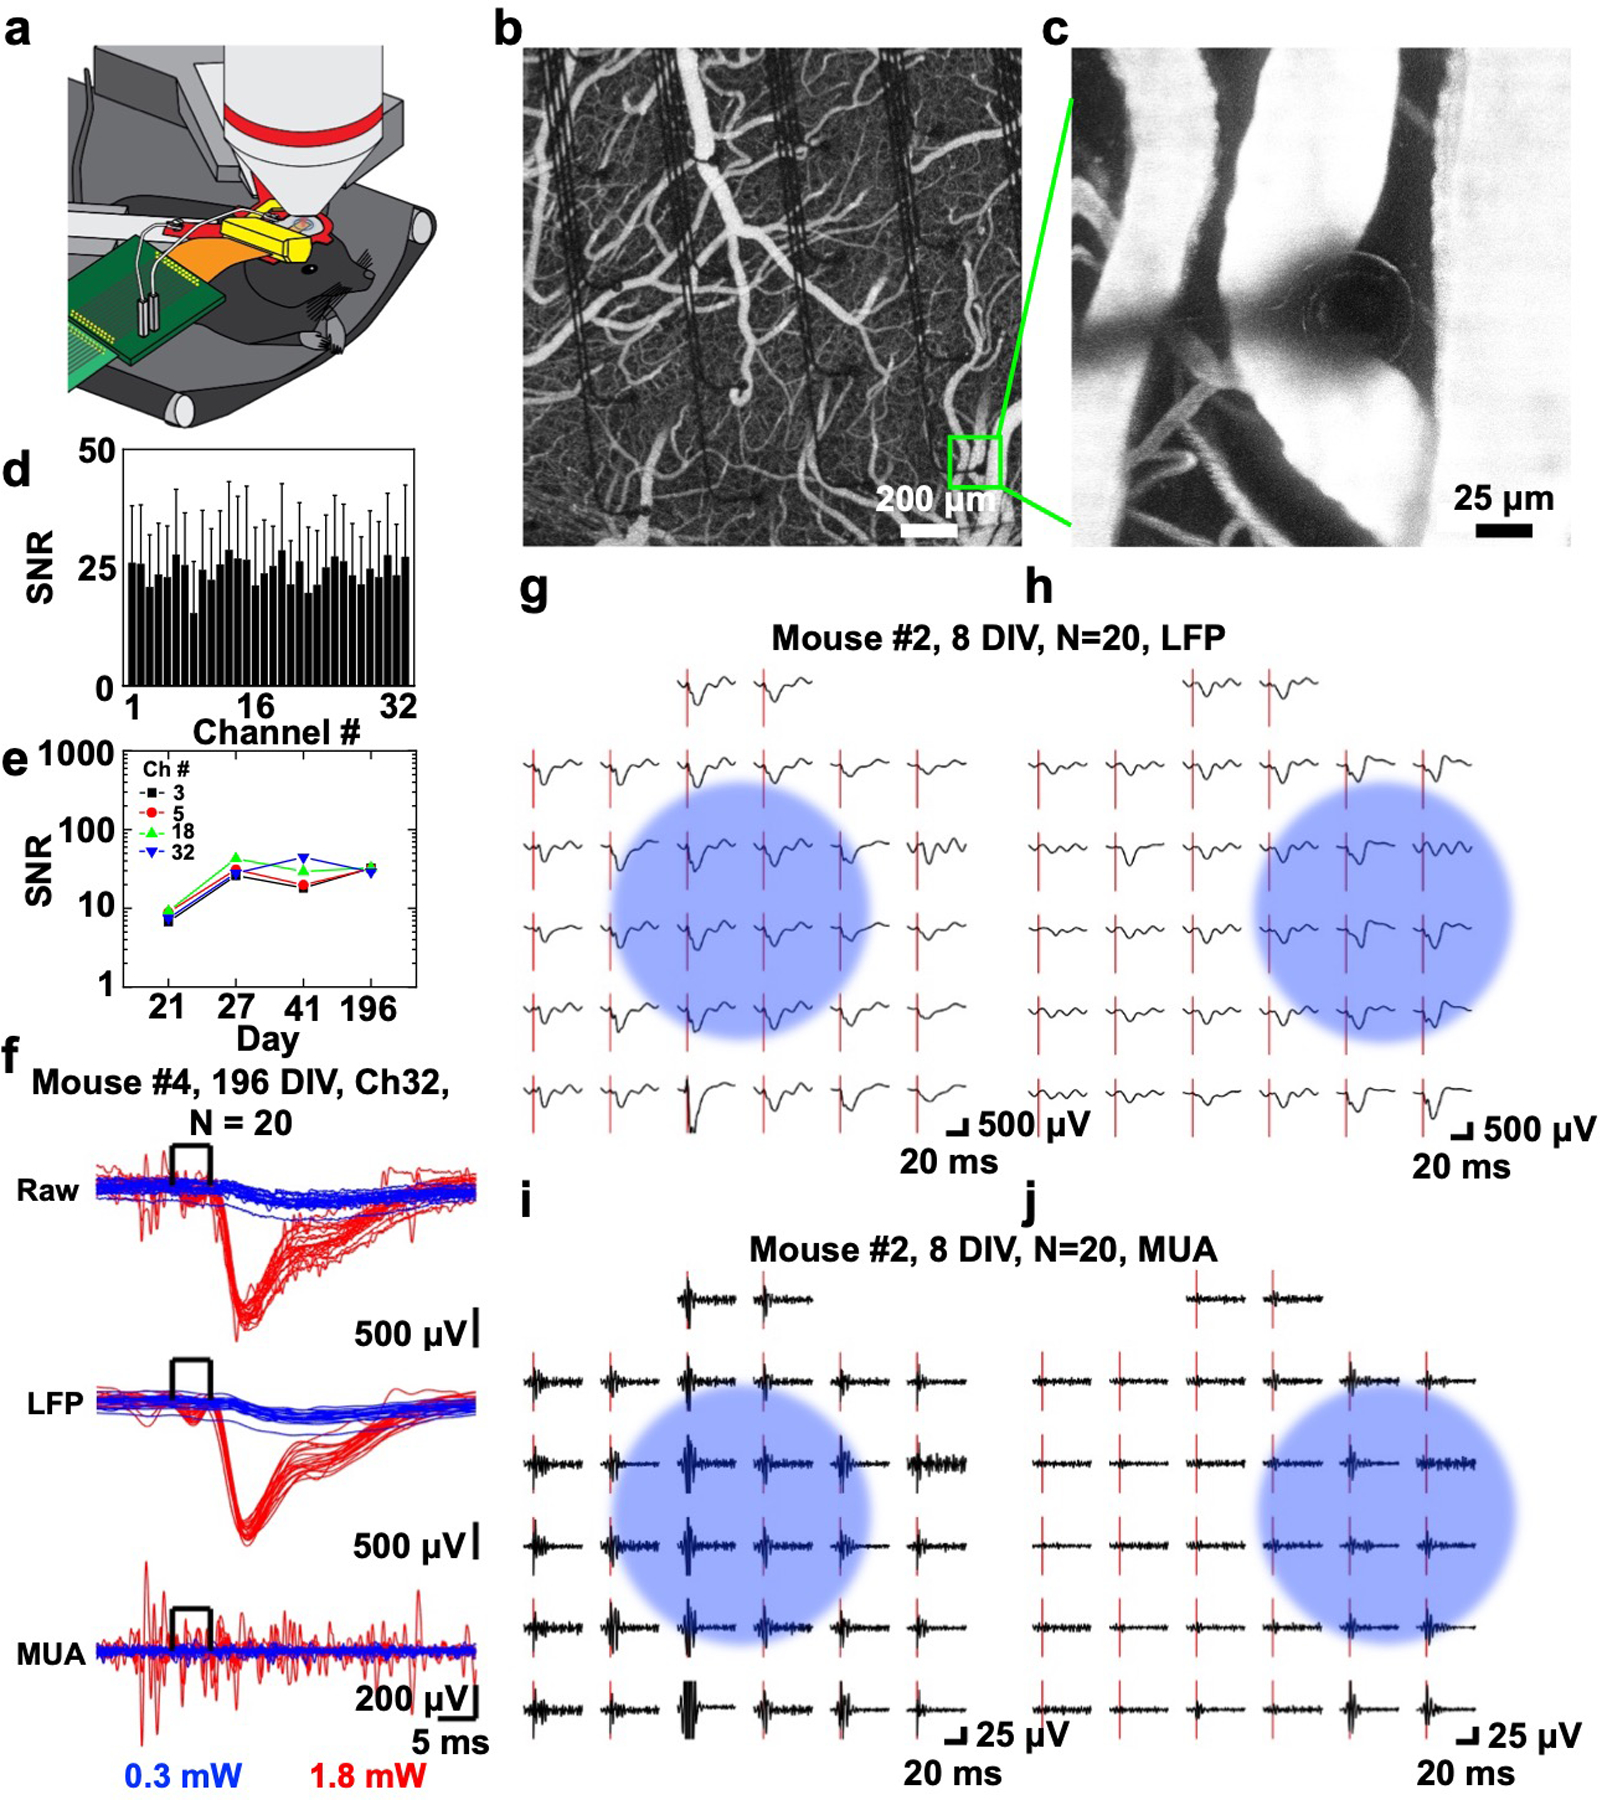
In vivo optogenetic photostimulation-evoked responses. a) Schematic illustration of chronic in vivo optogenetic experiment setup showing microscope objective for optogenetic photostimulation (top), custom titanium head frame (red) supporting custom 3D-printed headpost (yellow), and PCB connector (green) leading to the recording system. b) Two-photon image of the 400 μm spacing 32-channel SiMNA on flex implanted on mouse somatosensory cortex after intravenous injection of Alexa 680-Dextran. c) A magnified two-photon image from the same device b) focused on a SiMN. d) Histogram of average SNR and standard deviation of 1.8 mW photostimulation-evoked responses (unfiltered) for 32 channels (up to 196 DIV). e) SNR change of four channels in the center of the SiMNA (up to 196 DIV). f) Stacks of optogenetic photostimulation-evoked electrical potentials from all individual trials (N = 20) from a single channel (Ch32) of a 400 μm spacing 32-channel SiMNA at 196 DIV. Raw and filtered data (LFP: 1–250 Hz, MUA: 250–3000 Hz) for 0.3 mW (blue) and 1.8 mW (red) 450 nm laser power for optogenetic photostimulation (5 ms square pulse). g–j) Average potential waveforms in response to optogenetic photostimulation (onset: red bar) on the 400 μm spacing 32-channel SiMNA on at 8 DIV (N = 20). Blue circle indicates the approximate area of focus for the photostimulation beam; g,h), LFP; and i,j) MUA.
