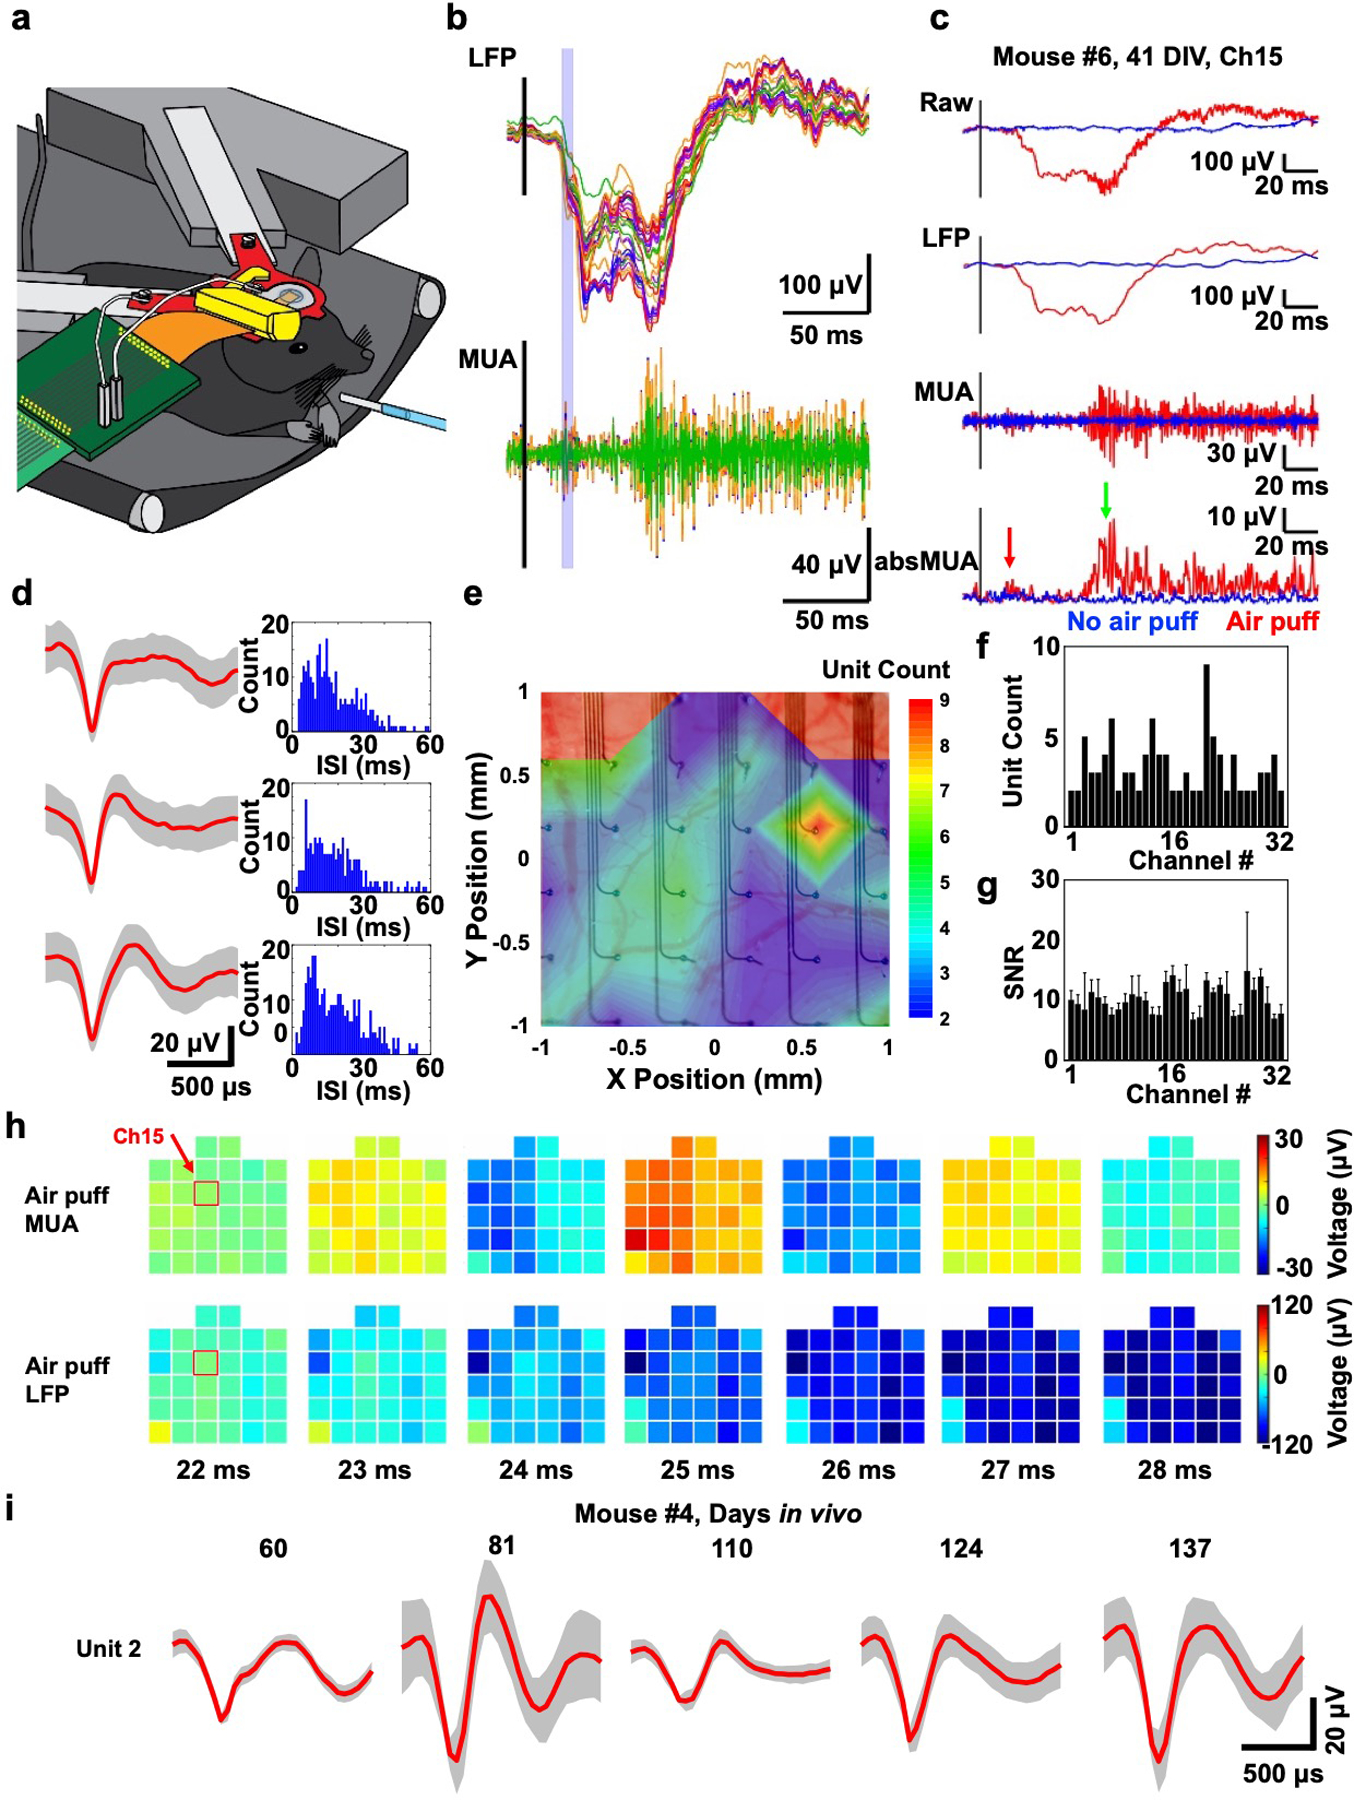
Figure 3.

In vivo whisker air puff stimulation-evoked responses at 41 DIV (mouse #6). a) Schematic illustration of the chronic in vivo recording setup showing on the right a glass tube for whisker air puff stimulation (blue). b) Average (N = 20) filtered whisker air puff stimulation-evoked responses from all channels of the 400 μm spacing 32-channel SiMNA on flex implanted on mouse somatosensory cortex. c) Average filtered whisker air puff stimulation-evoked responses from a single channel (Ch15). d) Three single units and corresponding interspike interval histograms detected from Ch15 of the same mouse. e) Colormap of number of detected single units per channel overlayed on the image of the implanted device. f) Histogram of number of detected single units per channel. g) Histogram of average SNR and standard deviation of air puff stimulation-evoked responses (unfiltered) for 32 channels (up to 54 DIV). h) Colormaps of the amplitude of filtered whisker air puff stimulation-evoked MUA and LFP responses at 22–28 ms poststimulus, corresponding to blue highlighted region in b). Ch15 from c is highlighted (red box) at 22 ms poststimulus. b–h), LFP: 1–250 Hz, MUA: 250–3000 Hz, absMUA: rectified MUA, i) Single unit waveforms (type 2) detected from Ch32 of SiMNA implanted on mouse #4 from various measurement days.
