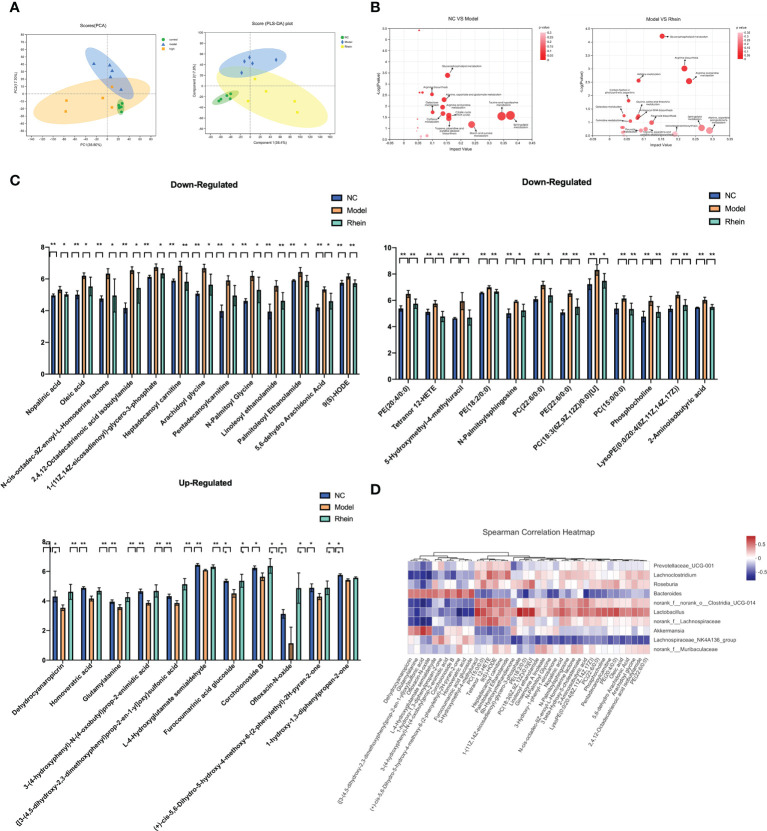
Figure 3.
Rhein protects against D-galactosamine/LPS-induced altered feceal metabolites. (A) Principal component analysis (PCA) (PC1 = 38.8%): the partial least squared discriminant analysis (PLS-DA) score plot based on LC-MS profiling data of feceal samples (compound1 = 47.2%). Each dot with three kinds of color represents the different samples. (B) Meaningful metabolic pathways in the comparison of NC and Model group, and Model and Rhein groups. (C) Based on VIP > 1, P < 0.05, FDR < 0.05 as a filter for differential metabolites between normal control and ALF groups, and rhein treatment significantly improved metabolic disorders, *p < 0.05 and **p < 0.01. (D) Heatmap of the correlation between the altered microbial community and significantly changed metabolites. The color indicates the Spearman’s correlation coefficient.

