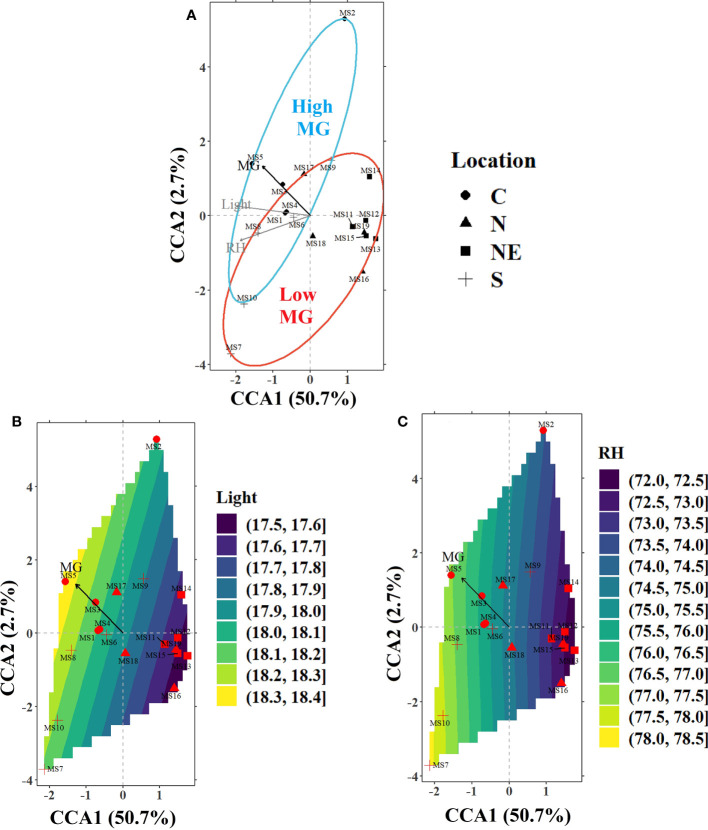
Figure 3.
(A) CCA ordination plot for the significant environmental variables in the air sub-model (light intensity; light and relative humidity; RH) influencing the alkaloid levels in the sampled trees from various locations around Thailand indicated by different markers (filled circles-C, filled triangles-N, filled squares-NE, and plus sign-S). The ellipses represent 90% confidence levels for content of MG (blue for high MG and red for low MG). The contours for the environmental variables in the bottom panels represent the landscape gradients as calculated by the ordisurf function in vegan library of R for (B) light (MJ m-2 day-1) and (C) RH (%).

