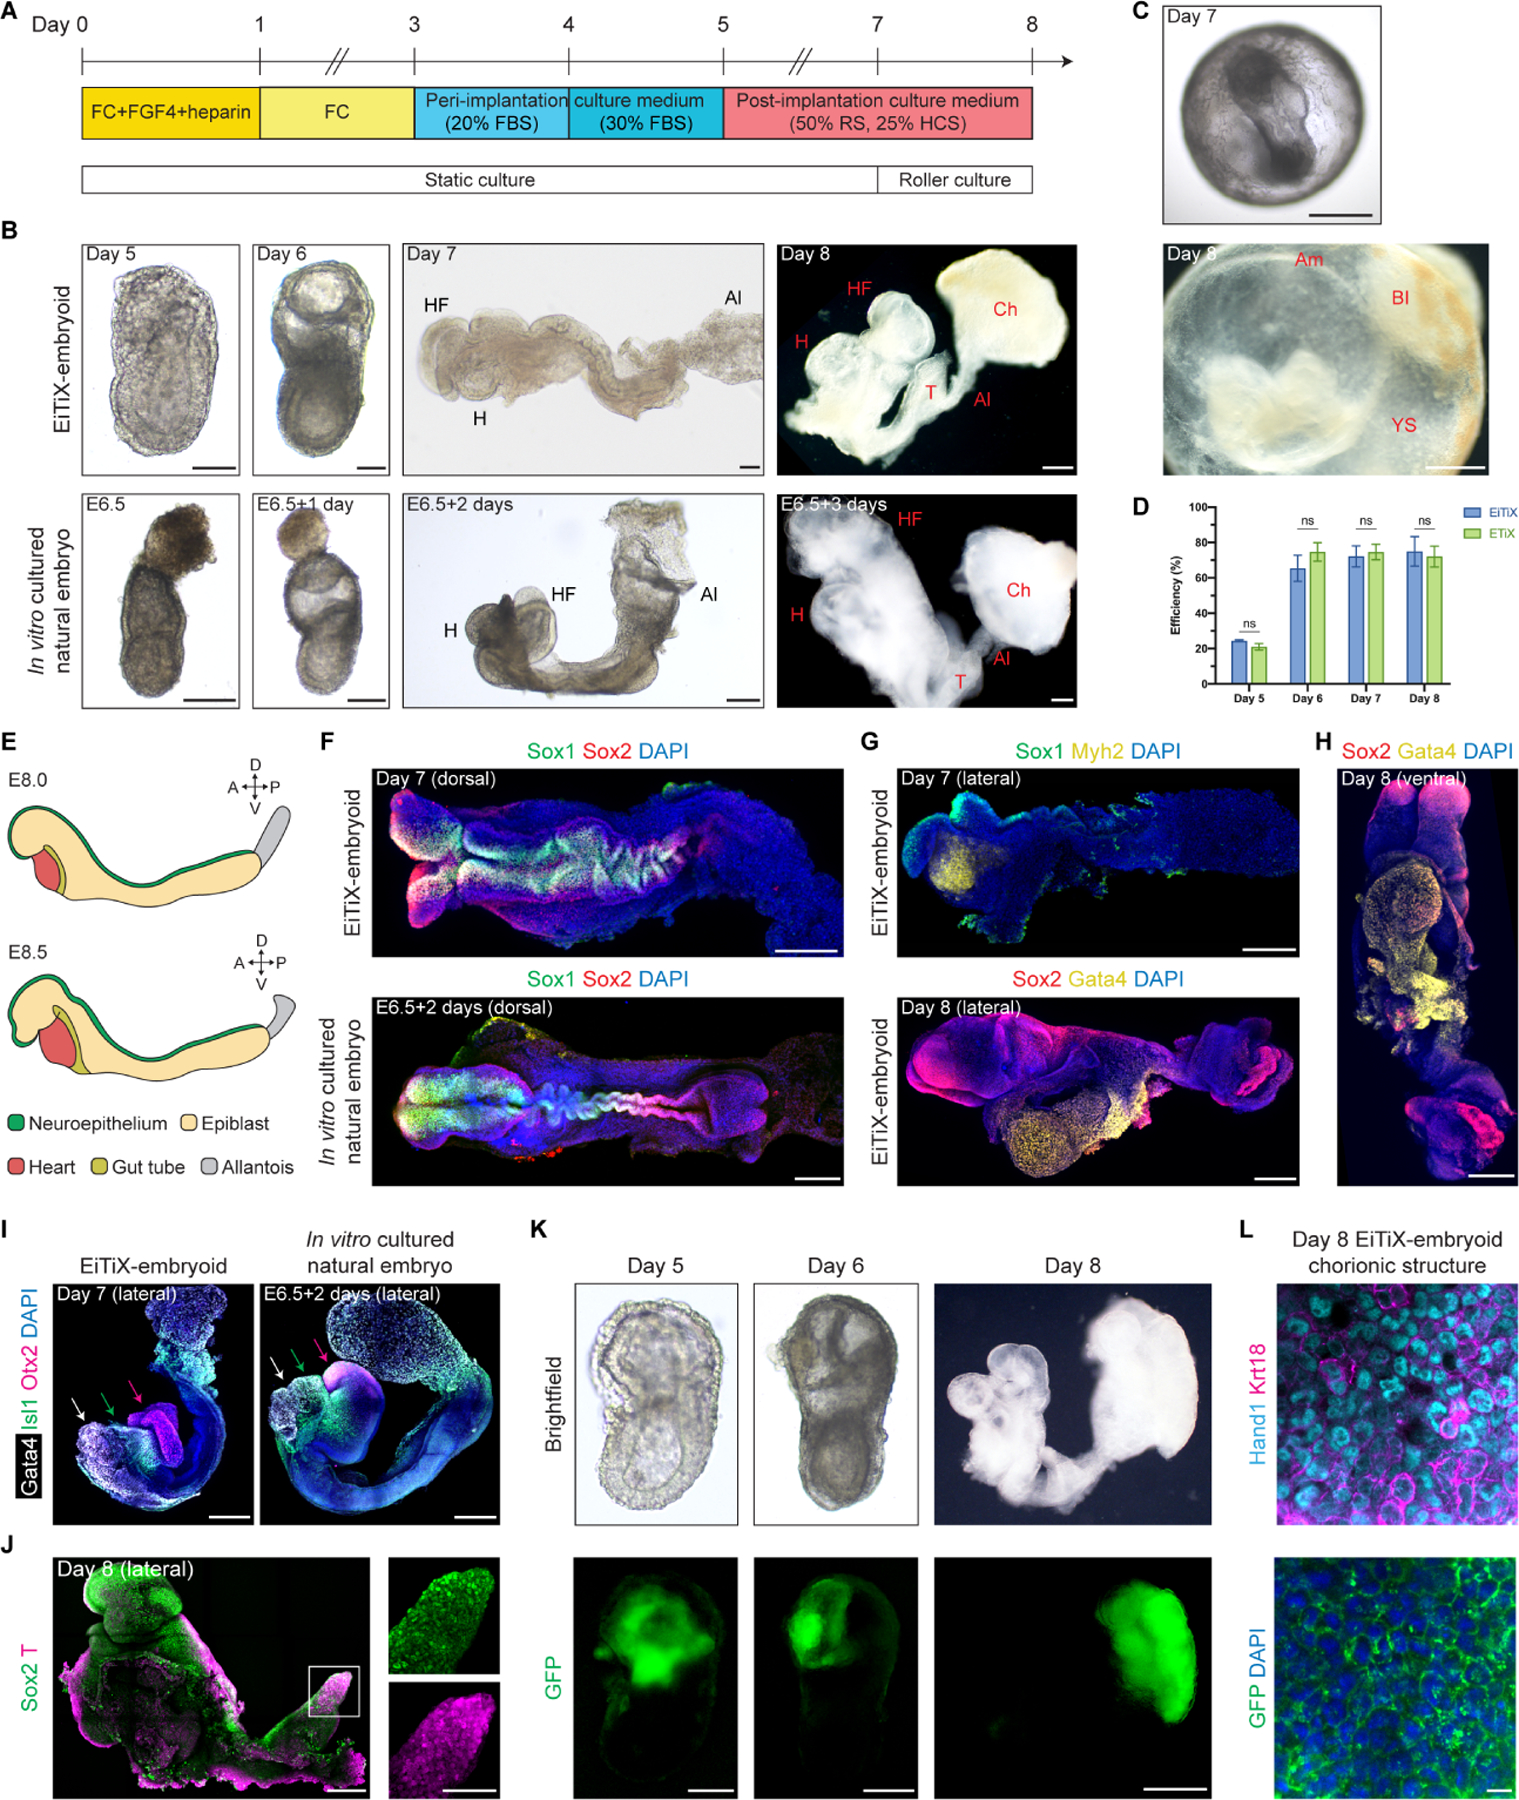
Figure 4. EiTiX-embryoids develop to late headfold stages with heart and chorion development.

(A) Schematic showing culture conditions of EiTiX-embryoids to Day 8. FBS: fetal bovine serum, RS: rat serum, HCS: human cord serum. (B) Representative brightfield images EiTiX-embryoids cultured from Day 5 to 8 and E6.5 natural embryo cultured in vitro for 3 days. Al: allantois, Ch: chorion, H: heart, HF: headfolds, T: tail. Scale bar, 100μm. (C) Brightfield images of Day 7 and Day 8 EiTiX-embryoids before dissecting yolk sac-like membrane. Am: amnion, BI: blood island, YS: yolk sac. Scale bar, 200μm (Day 7); 500μm (Day 8). (D) Efficiency of EiTiX-embryoid and ETiX-embryoid progression from Day 4 to 5, Day 5 to 6, Day 6 to 7, and Day 7 to 8. Efficiency of ETiX-embryoid is taken from our publication (Amadei et al., 2022). Embryoids were selected on each day for further culture and experiments were performed minimum 3 times. Multiple t-tests. ns, non-significant. (E) Schematic showing major cell types in E8.0 and E8.5 embryos. (F) Dorsal view of Day 7 EiTiX-embryoid and E6.5 natural embryo cultured in vitro for 2 days and stained to reveal Sox1 (green) and Sox2 (red). Scale bar, 200μm. (G) Lateral view of Day 7 and Day 8 EiTiX-embryoids stained to reveal neuroepithelial markers Sox1 (green) or Sox2 (red) and heart markers Myh2 or Gata4 (yellow). Scale bar, 200μm. (H) Ventral view of Day 8 EiTiX-embryoid stained to reveal Sox2 (red) and Gata4 (yellow), resembling the linear heart tube stage. Scale bar, 200μm. (I) Lateral view of Day 7 EiTiX-embryoid and E6.5 natural embryo cultured in vitro for two days stained to reveal heart marker Gata4 (white), pharyngeal mesoderm marker Isl1 (green), and forebrain marker Otx2 (magenta). Scale bar, 200μm. (J) Lateral view of Day 8 EiTiX-embryoids stained to reveal Sox2 (green) and T (red). Magnified panel showing co-expression in tail region (white square). Scale bar, 200μm; 100μm (zoomed). (K) Representative brightfield and GFP fluorescence image of Day 5 to 8 EiTiX-embryoids to track the contribution of CAG-GFP iCdx2 ESCs. Structures show GFP expression in chorion-like region. Scale bar, 50μm (Day 5); 200μm (Day 6); 500μm (Day 8). (L) Dissected chorionic structure from Day 8 EiTiX-embryoid stained to reveal GFP (green), Hand1 (cyan) and Keratin18 (magenta). Scale bar, 100μm. See also Figure S4 and Movie S1–2.
