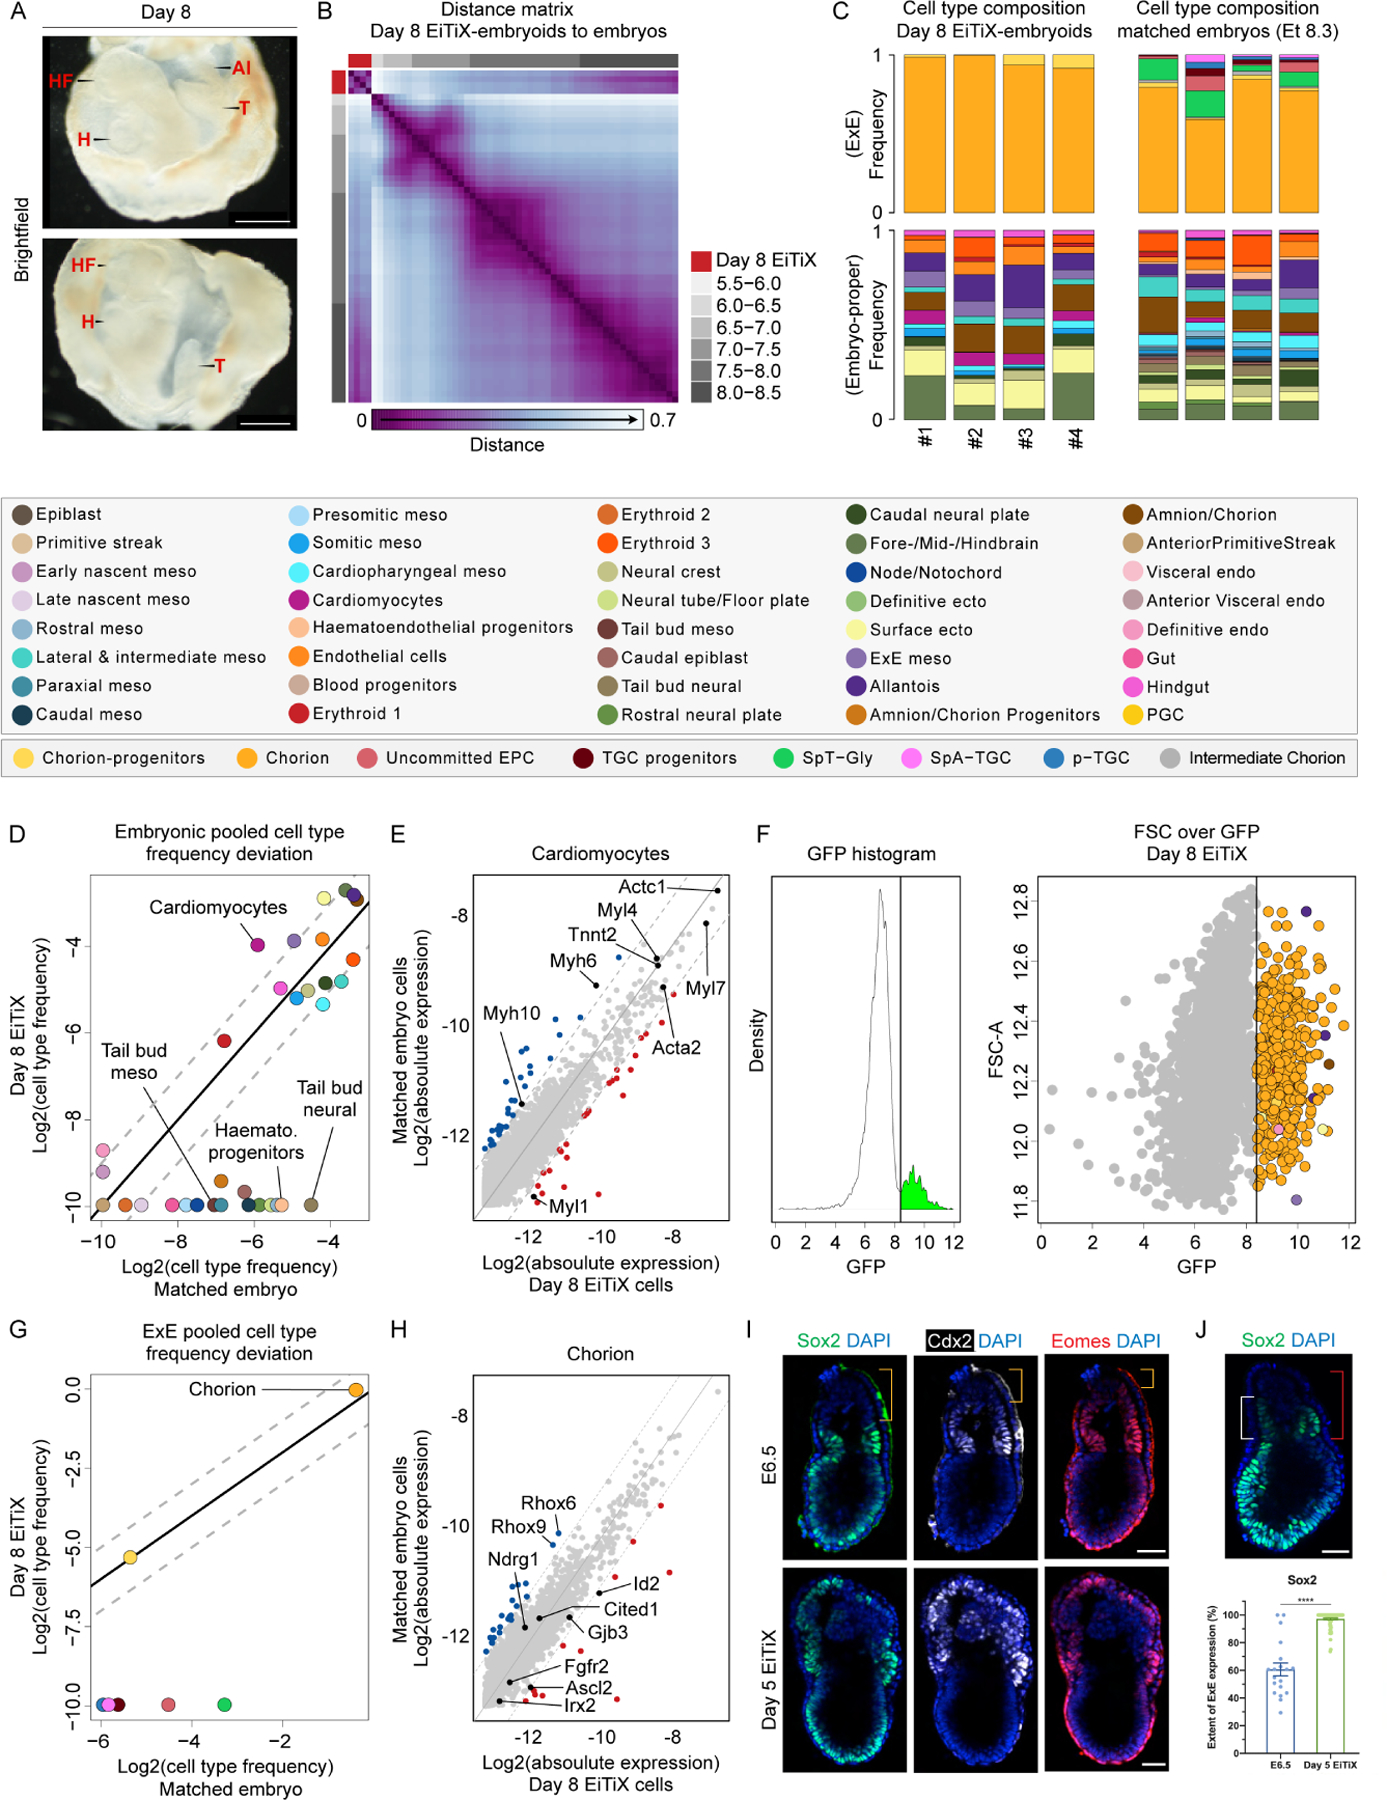
Figure 5. Cell state and composition analysis of neurulating embryoids using scRNA-seq.

(A) Brightfield images of Day 8 EiTiX-embryoids collected for single-structure, single-cell RNA sequencing. The yolk sac-like membrane was partially opened to reveal embryonic structures. Al: allantois, H: heart, HF: headfolds, T: tail. Scale bar: 500μm. (B) Embryo-embryo cell type composition similarity matrix. Natural embryos are annotated based on embryonic age groups (grey), Day 8 EiTiX-embryoids (red). (C) Cell type composition bars of individual Day 8 EiTiX-embryoids (left) and matched natural embryos (right, annotated according to the legend below). (D, G) Pooled embryonic (D) and ExE (G) cell type frequencies comparison between Day 8 EiTiX-embryoids and matched natural embryos. (E, H) Bulk differential gene expression per cell state of Day 6 EiTiX cells against matched embryo cells in embryonic cell type (E, cardiomyocyte) and ExE cell type (H, chorion). Dots represent individual genes. Colour annotated dots mark genes with a two-fold change in expression (blue – above two-fold decrease in Day 6 EiTiX cells, red – above two-fold increase in Day 6 EiTiX cells). (F) GFP channel bimodal distribution (left) with threshold use to define GFP+ cell population shown as dots, annotated accordingly to cell type (right). (I) Day 5 EiTiX-embryoids and E6.5 natural embryos stained to reveal trophoblast stem markers Sox2 (green), Cdx2 (white) and Eomes (red). Orange brackets show the absence of trophoblast stem markers in the tip of ExE in E6.5 embryos. Scale bar: 50μm. (J) Quantification of the extent of ExE expression of Sox2. It was determined by dividing the height of the expression domain (white bracket) by the height of ExE (red bracket), multiplied by 100%. n = 19 E6.5 embryos from 2 experiments and 78 Day 5 EiTiX-embryoids from 3 experiments; ****p < 0.0001. Scale bar: 50μm. See also Figure S5.
