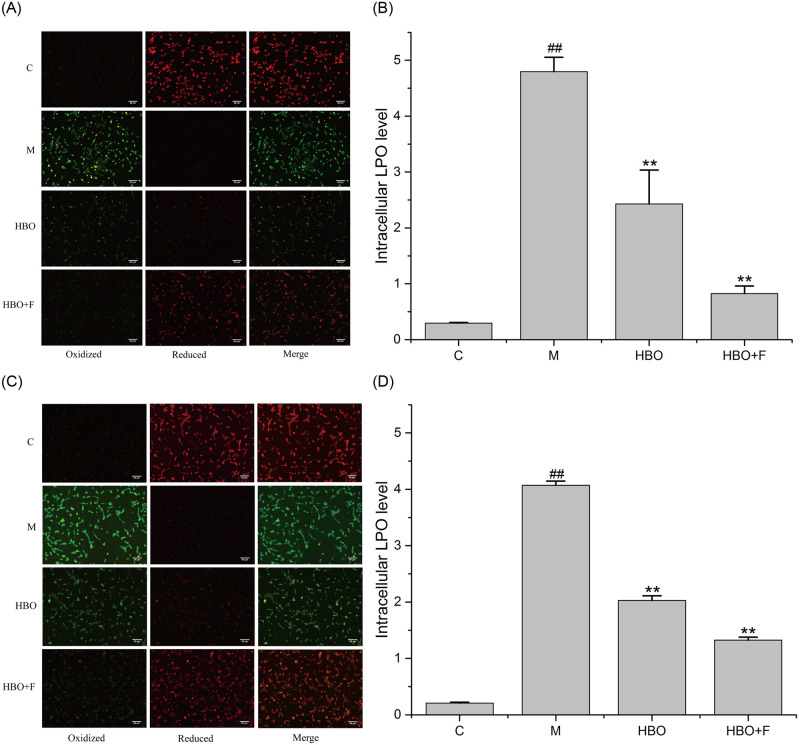
Fig 4. The effect of HBO on Lipid ROS of HT22 cells (A, B) and PC12 cells (C, D) (200×).
The results are presented as the mean ± SEM (N = 3). ##P < 0.01 vs. control group, *P < 0.05, **P < 0.01 vs. model group. C: Control group; M: Model group; HBO: Hyperbaric oxygen group; HBO+F: Hyperbaric oxygen + Ferrostatin-1 group. LPO: Lipid reactive oxygen species.

