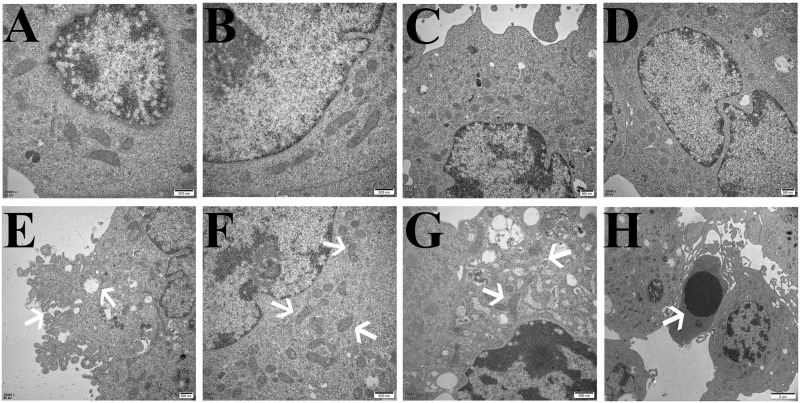
Fig 7. Ultrastructural changes related to ferroptosis in PC12 cells observed by transmission electron microscopy.
A, B: Control group, with normal cell structure. C, D: HBO group, the cell structure was significantly improved compared with the model group. E,F,G,H: Model group, E: Cell membrane rupture and blebbing; F: Mitochondria become smaller; G: Mitochondrial degeneration; H: Apoptotic body.

