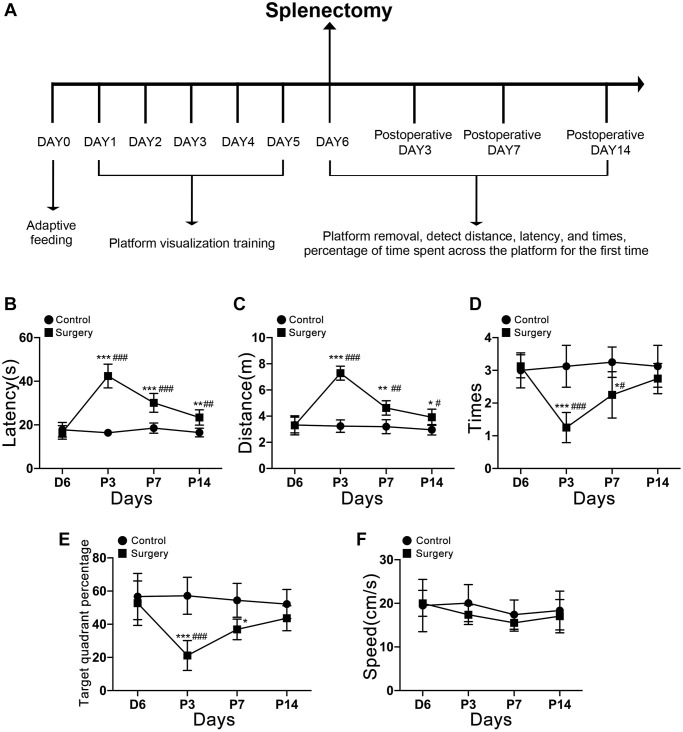
Figure 2.
Timeline diagram of the Morris Behavior Test. (A) Morris water maze testing of aging mice 3, 7, and 14 days after splenectomy. (B) The time that the aging mice reach the platform for the first time. (C) The distance taken by the aging mice to reach the platform for the first time. (D) The number of times the platform was crossed in 60 s. (E) The percentage of the total time for the aging mice to cross the target quadrant. (F) There was no significant difference in swimming speed at each time point (P > 0.05). The data are presented as mean ± SEM. *P < 0.05 indicated that there was a significant difference between the two groups at corresponding time points. #P < 0.05 indicated that compared with C6, P3, P7, and P14 significantly changed. Control c. Surgery: Surgery group. C6: the incubation period of positioning voyage is day 6. P3, P7, P14: postoperative days 3, 7, and 14.

