Figure 2.
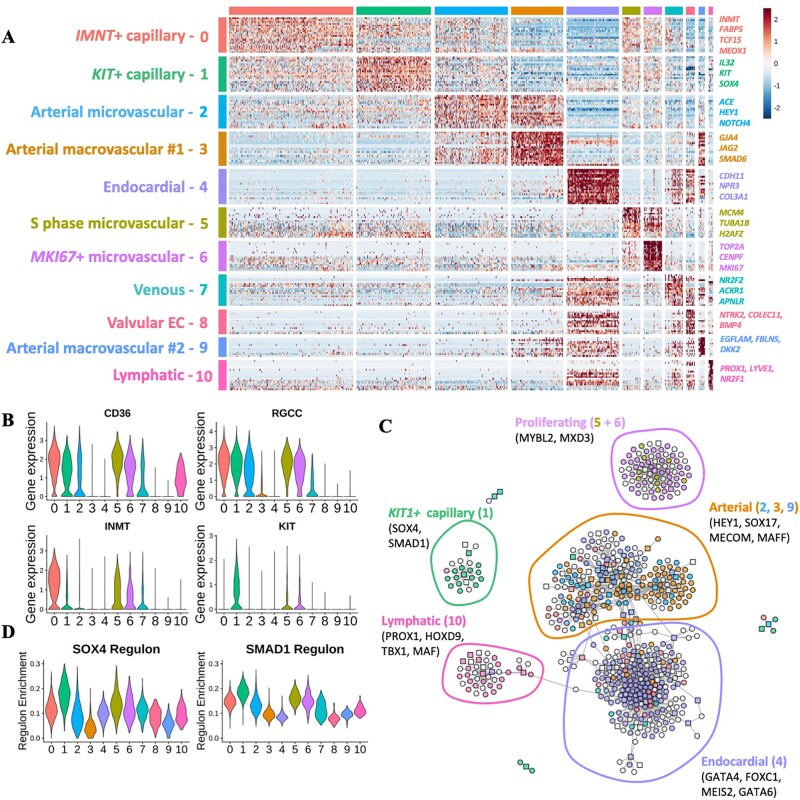
GRN analysis of human foetal heart endothelium. (A) Heatmap of differentially expressed cluster genes: expression of top 20 DEGs for each cluster identified in the complete dataset. Genes were grouped according to the cluster in which they were differentially expressed. (B) Violin plots: expression of CD36, RGCC, INMT, and KIT across clusters identified in foetal heart EC dataset. (C) GRN constructed using SCENIC analysis. TFs and target genes shown as squares or circles, respectively. Genes are coloured based on the cluster in which they were differentially expressed. White nodes represent gene targets that were not differentially expressed. (D) Violin plots showing enrichment/AUC score of SOX4 and SMAD1 regulons across identified clusters.

