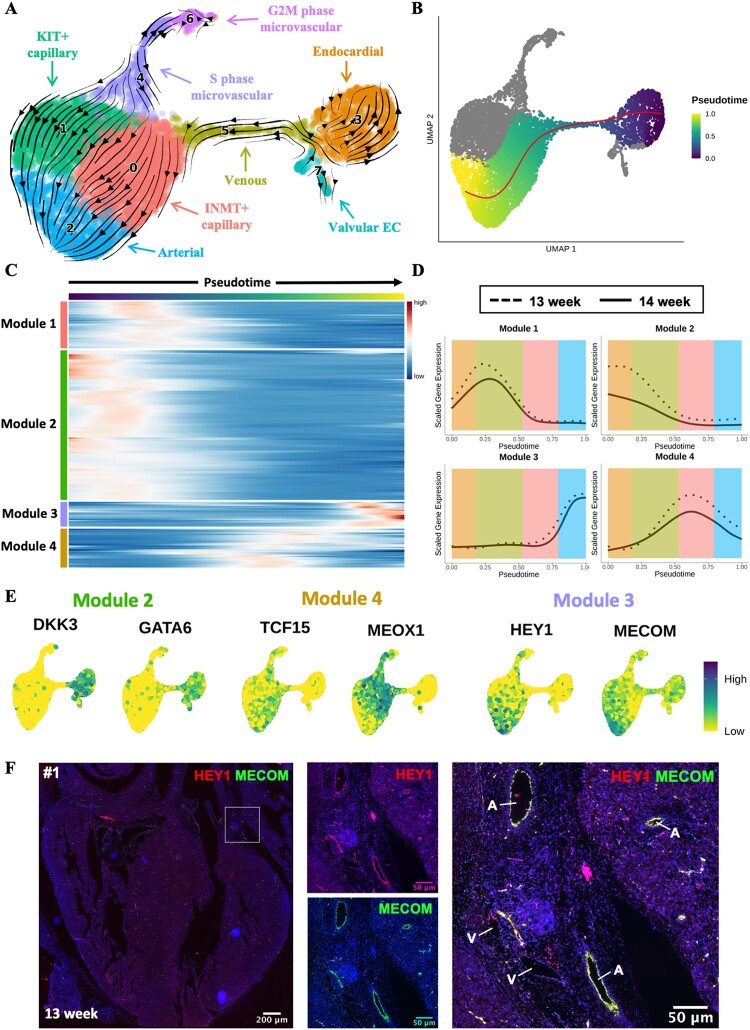
Figure 3.
Trajectory inference analysis of developing cardiac endothelium. (A) RNA velocity analysis of microvascular cardiac endothelium. The RNA velocity field shown superimposed onto a UMAP visualization of microvascular cardiac ECs. (B) Slingshot trajectory demonstrating pseudotemporal cellular dynamics. (C) Heatmap of 200 genes found to be most differentially expressed across pseudotime of trajectory from (B). Genes grouped into modules by k-means clustering (k = 4). (D) Smoothing spline curves show average sample scaled gene expression for genes within modules identified in (A). (E) Feature plots showing expression of selected genes from Modules 2 (DKK3 and GATA6), 3 (MECOM and HEY1), or 4 (TCF15 and MEOX1). (F) ISH validation of co-expression of MECOM (green) with HEY1 (red) in arterial EC of a 13-week human foetal heart (sample #1). See Supplementary material online, Figure S5A for samples #2, #3, and #4. A, artery; V, vein.

