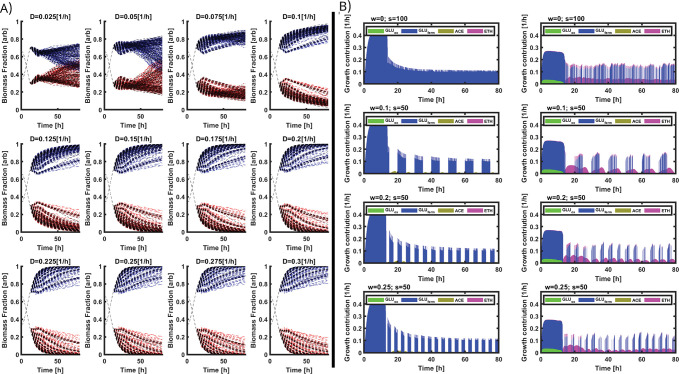
Fig 6.
A) Simulations of the fraction for each microorganism found for the pulsed continuous cultures at different feeding profiles. E. coli (red) and S. cerevisiae (blue). B) Growth rate contributions related to each Ψrel for each strain, E. coli left column, S. cerevisiae right column. Four simulations at different frequencies (w) and step-times (s) are shown. Metabolic paths are color coded as follows: GLU fermentative/unbalanced consumption in blue, ACE consumption in yellow, ETH consumption in purple, and GLU oxidative/balanced consumption in green.

