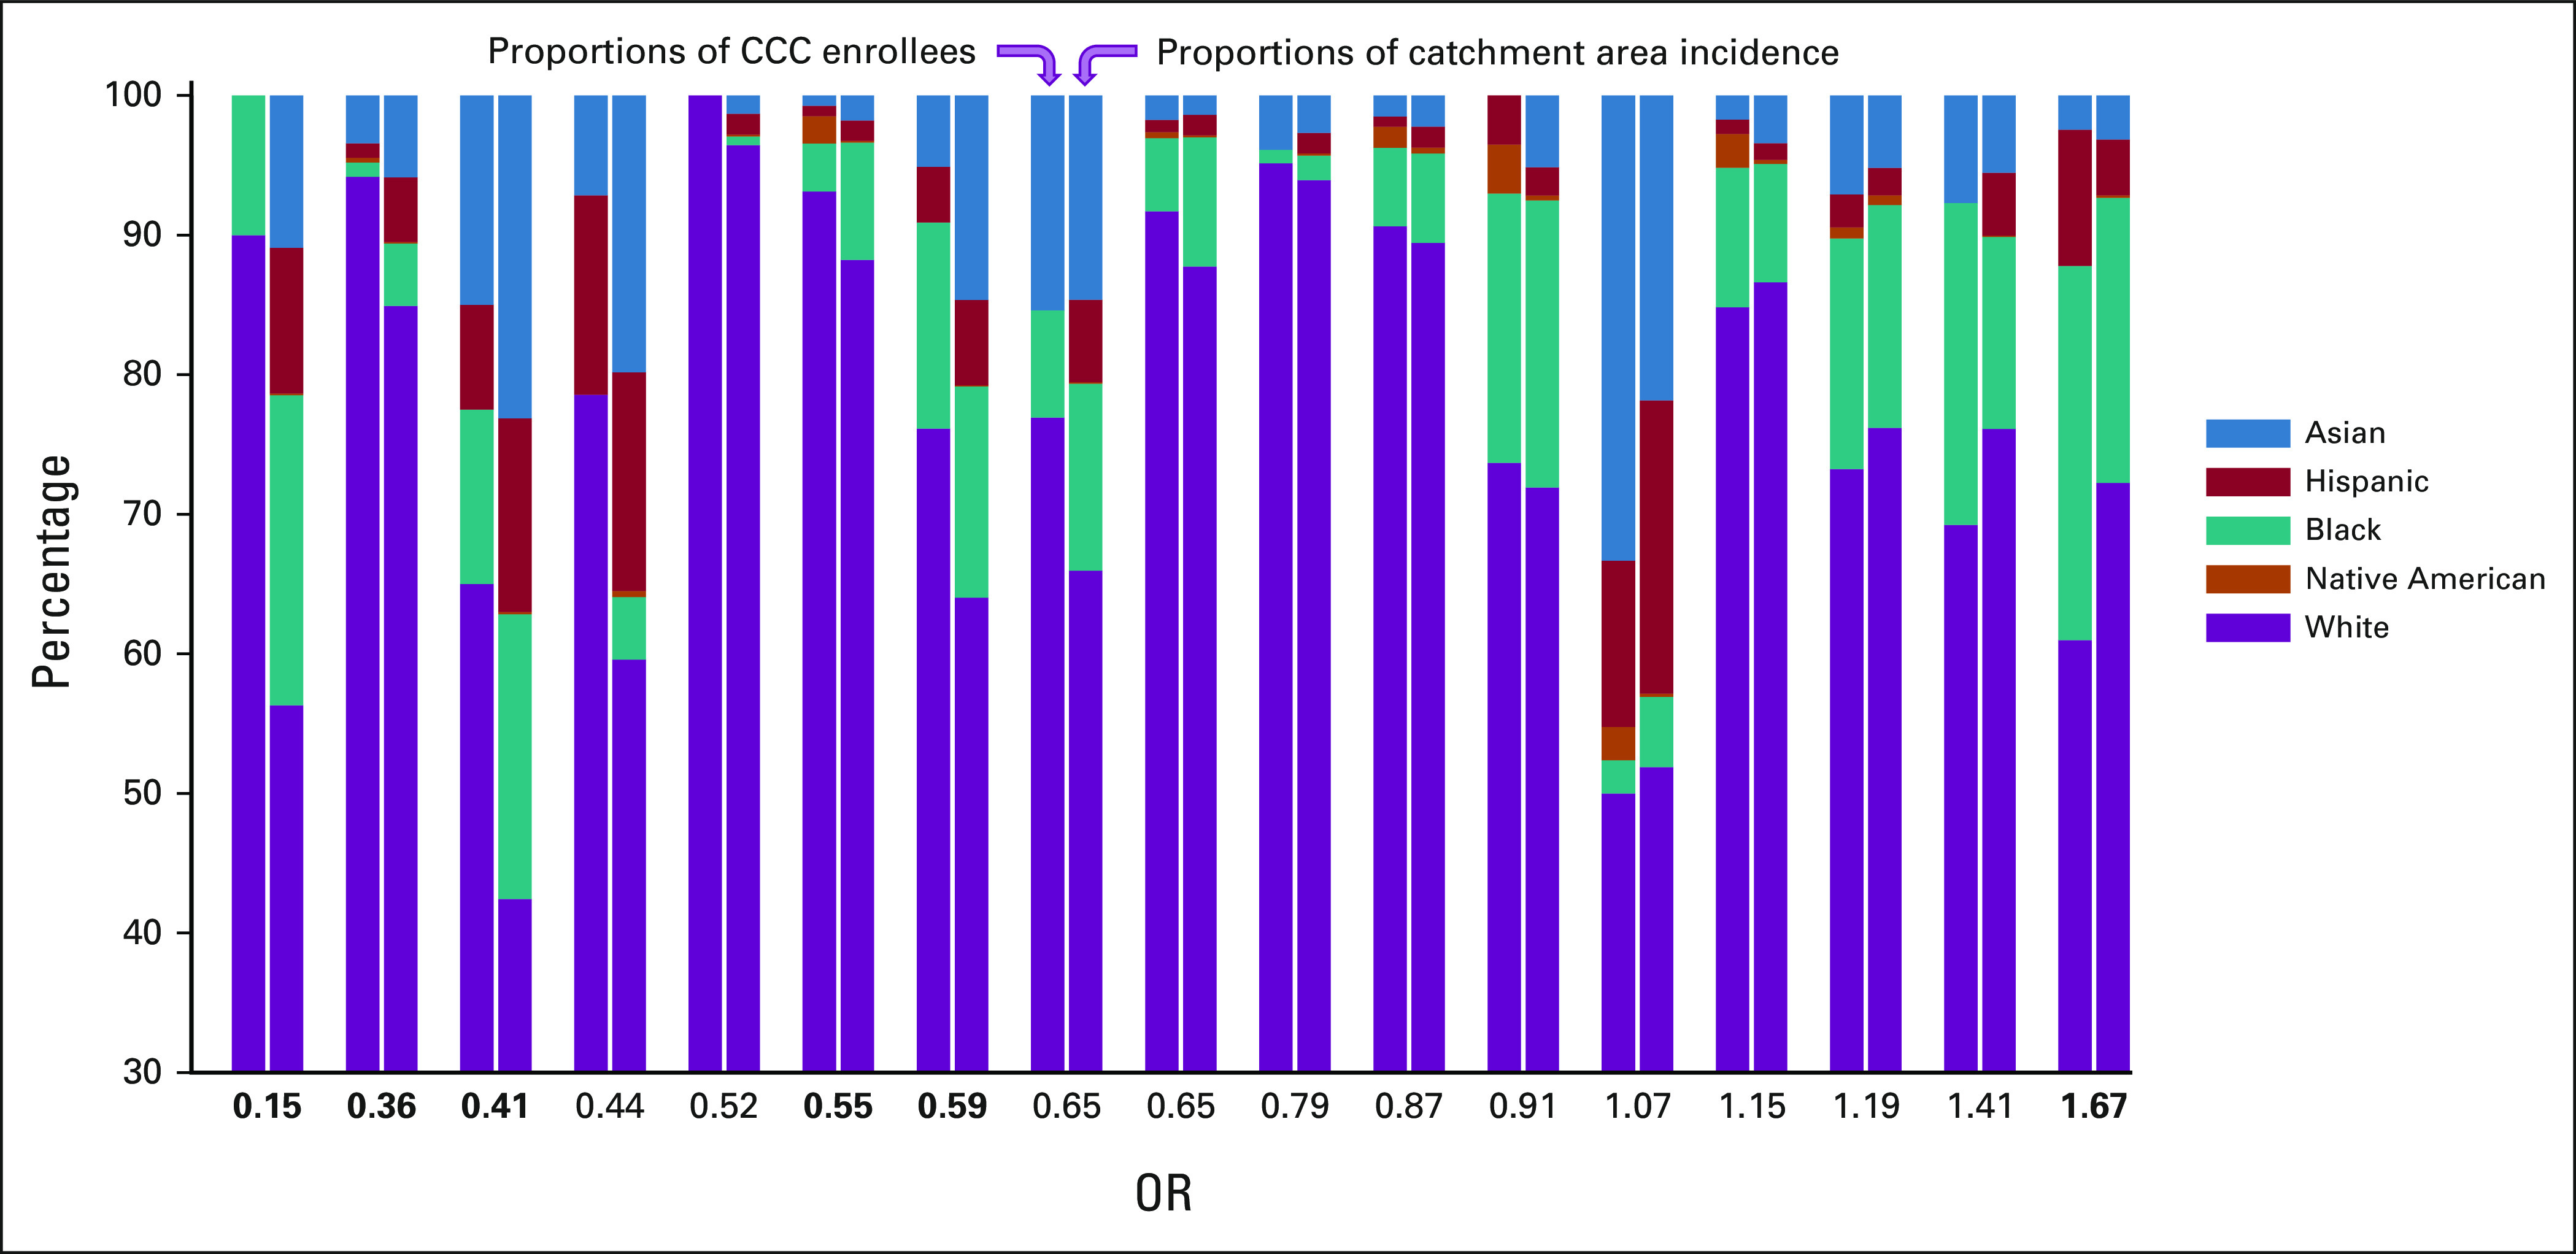
FIG 3.

Enrollment proportions by race-ethnic group for the 17 CCC sites recruiting ≥ 10 patients to clinical trials relative to catchment area incidence. Each sites' proportions are displayed as stacked bars, with the proportion of all enrollees at the site in the left bar and the proportion of the catchment areas incident cases in the right bar. Site disparity ORs are shown below the corresponding sites (χ2 odds of diverse enrollment relative to non-Hispanic White enrollment, using estimated site catchment area incidence). Bold values indicate significant differences (P < .05). Sites are positioned left to right in order of increasing odds of enrolling diverse patients. Note that the vertical axis scale starts at 30%. CCC, Comprehensive Cancer Center; OR, odds ratio.
