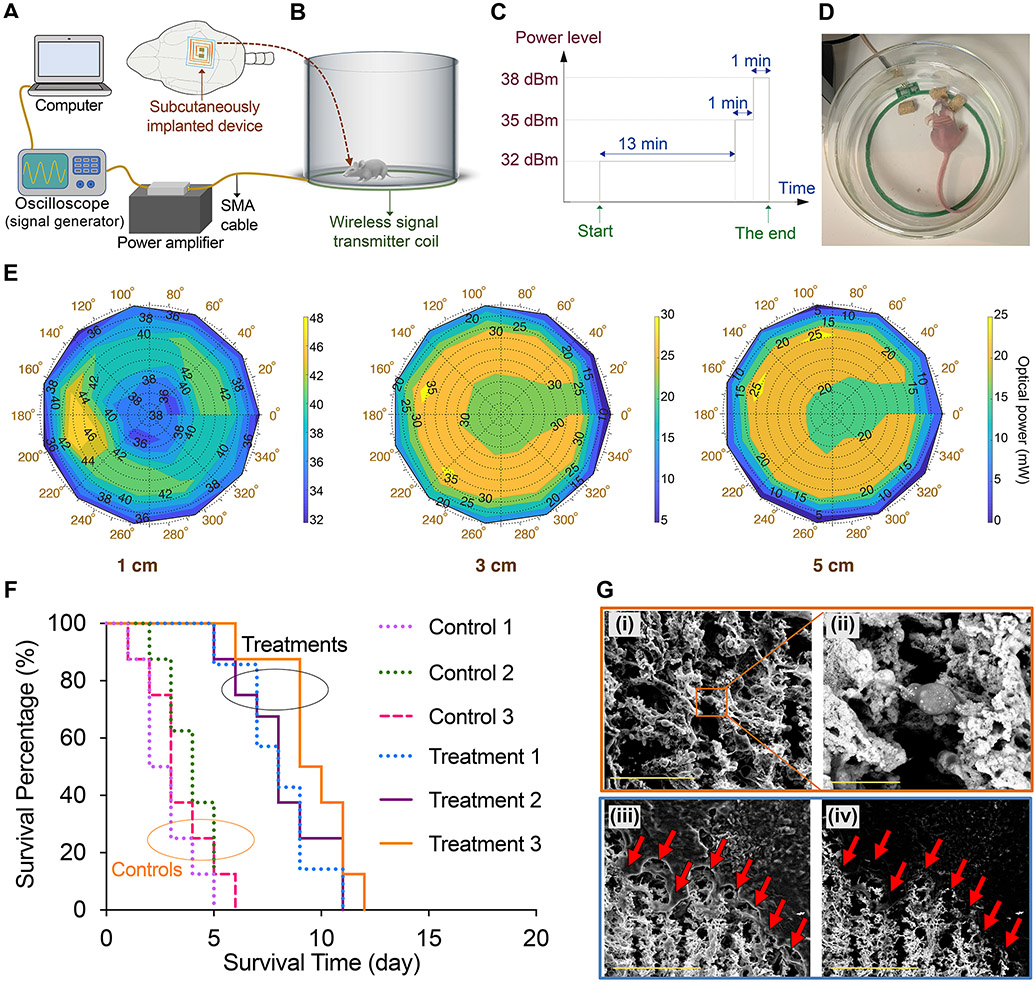
Fig. 4. Wireless photothermal therapy of brain tumors in freely-behaving mice.
(A and B) Schematic showing the computer-controlled wireless power delivery setup used for photothermal therapy of brain tumors. (C) Multi-level powering scheme used for continuous therapy on a daily basis for 940-nm devices (see Supplementary Figs. 24 and 30 for details). (D) Photograph showing a mouse eating during the wireless tumor therapy session, indicating that our approach did not disturb animal’s normal behavior (also see Supplementary Fig. 25 and Supplementary Video 1). (E) Plots showing optical power versus the polar position of the NIR-emitting devices (940 nm, pre-implantation) from the center of the wireless transmitter (TX) coil to evaluate variations of the optical power with height changes to account for movement of the mice. Also, see Supplementary Figs. 26-28 for measurement setup and other related plots for both 810- and 940-nm devices. (F) Survival profiles of the mice with human U87-eGFP-fLuc glioblastoma tumors treated with wireless photothermal approach (Treatment groups 1, 2, and 3) compared with control mice (n=10/group, total=60). NPs (1 μL, 0.5 nM) were injected intratumorally, and photothermal therapy was started after 24 h (15 min per day for 15 days). [Control 1: NPs (−), Implantation (−); Control 2: NPs (+), Microfiber (+), Irradiation (−); Control 3: NPs (+), Device (+), Irradiation (−); Treatment 1: NPs (+), Microfiber (+), Irradiation [810 nm] (+); Treatment 2: NPs (+), 810 nm Device (+), Irradiation (+); Treatment 3: NPs (+), 940 nm Device (+), Irradiation (+)]. Significant differences were observed when comparing each treatment group with control profiles (p<0.05, using the log-rank test). Also see survival results for mice with GL26 and GBM39 tumors, as well as combination therapy results in Supplementary Figs. 41-43. (G) Secondary electron (i and iii) and backscattered (ii and iv) SEM images of a brain section, showing photothermal effect of the nanoparticles (porous areas shown with arrows) in tumor tissue. All bright contrast spots in backscattered images (ii and iv) represent gold nanoparticles due to their enhanced electron backscattering (see Supplementary Figs. 44-48 for more detailed histological analysis of the tumors at the end of therapies). Scale bars in (i), (ii), and (iii-iv) represent 50, 10, and 100 μm, respectively.

