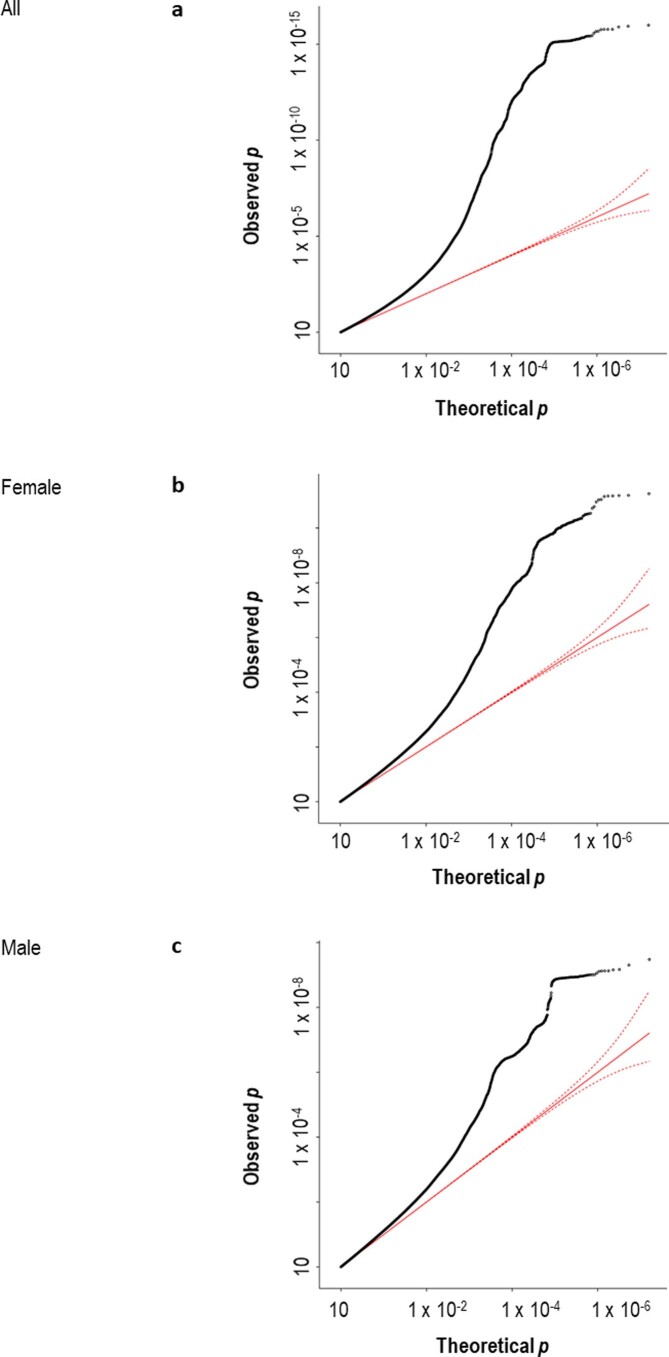
Extended Data Fig. 1. QQ plot of dyslexia GWAS results.
a-c, Quantile-quantile (Q-Q) plots of observed versus expected P values for associations of single nucleotide polymorphisms with self-reported dyslexia diagnosis in a genome-wide association analysis for all participants (n = 51,800 cases, 1,087,070 controls) (a), female participants (n = 30,287 cases, 641,016 controls) (b), and male participants (n = 21,513 cases, 446,054 controls) (c). The solid red line represents the distribution of P values under the null hypothesis, and the dashed red line represent 95% confidence intervals. The black circles represent the observed distribution of P values.

