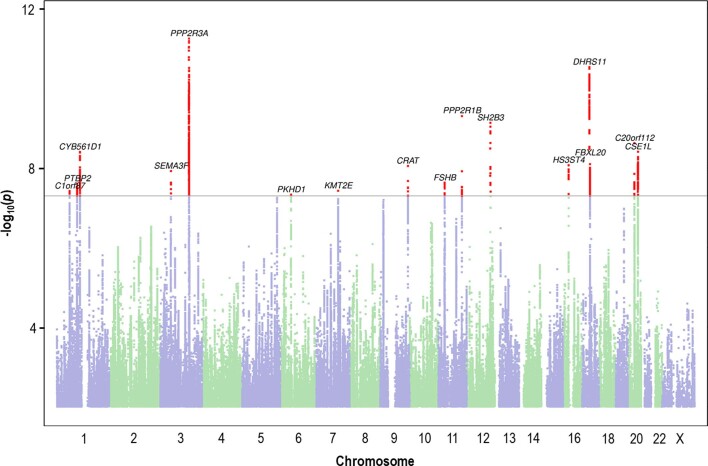
Extended Data Fig. 2. Manhattan plot of dyslexia GWAS results for females.
The y-axis represents the -log10 P value for association of single nucleotide polymorphisms with self-reported dyslexia diagnosis from 30,287 female individuals and 641,016 female controls. The threshold for genome-wide significance (P < 5 × 10⁻⁸) is represented by a horizontal grey line. Genome-wide significant variants in the 17 genome-wide significant loci are red. Variants located within a distance of 250 kb of each other are considered as one locus.

