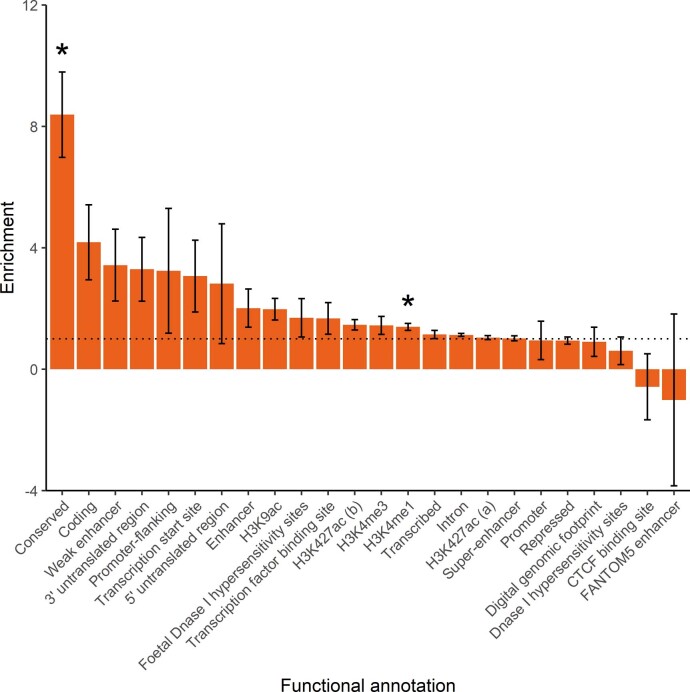
Extended Data Fig. 5. Enrichment estimates for major functional annotations.
The 24 major functional annotations were defined by Finucane et al.39. Enrichment is the proportion of h2/proportion of SNPs. The horizontal dotted line indicates no enrichment (where proportion of h2/proportion of SNPs = 1). Error bars represent standard errors of the enrichment estimates. Asterisks indicate enrichment estimates are significant based on a Bonferroni-derived P value of < 2.08 × 10⁻³ (for 24 tests). Exact values of enrichment statistic, standard error, and P value can be found in Supplementary Table 16.

