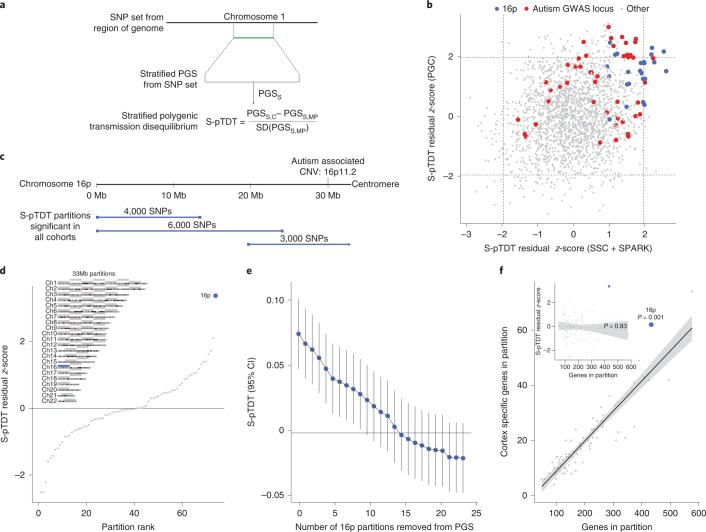
Fig. 1. S-pTDT identifies exceptional polygenic signal at chromosome 16p.
a, S-pTDT estimates transmission of stratified PGSs from parents to their children. PGSS is a stratified PGS constructed from a continuous block of SNPs, denoted in green. The S-pTDT value for a parent–child trio is the normalized difference between the stratified PGS in the child and the average stratified PGS of their parents. b, Genome-wide S-pTDT analysis using European ancestry autism probands in the combined SSC + SPARK cohorts (x axis, n = 5,048 trios) and the PGC (y axis, n = 4,335 trios). Blue points are partitions on 16p and red points are partitions including an autism GWAS locus. Score weights are derived from an autism GWAS of the iPSYCH consortium. The axes are in units of S-pTDT residual z-scores (Methods) and dashed lines denote z-scores ± 1.96. c, The three partitions that are nominally significant in both combined SSC + SPARK and PGC (blue bars) collectively span 16p. d, Autism S-pTDT analysis of the combined SSC + SPARK cohorts with stratified PGSs constructed from the 33-Mb partitions. Inset: the 16p partition (blue bar) compared with 73 other 33-Mb partitions (gray bars) spanning the genome. e, SSC + SPARK autism S-pTDT (n = 5,048 trios) signal decaying gradually with successive removal of the most associated remaining linkage disequilibrium-independent block on 16p. The y axis is the S-pTDT estimate (±95% confidence interval (CI)) for transmission of a stratified PGS constructed from the union of the remaining blocks. f, Each point is shown as a 33-Mb partition as defined in d. Brain-specific genes are defined as genes in the top 10% of specific expression in cortex relative to nonbrain tissues in GTEx. The P value is calculated from the residual z-score in a linear model regressing the number of cortex-specific genes on the number of genes in the partition (two sided). Inset: the P value is from Pearson’s correlation of number of genes in partition and S-pTDT residual z-score (two sided). For both the inset and the main panel, the trend line is a linear best fit and the shaded regions denote a 95% CI.

